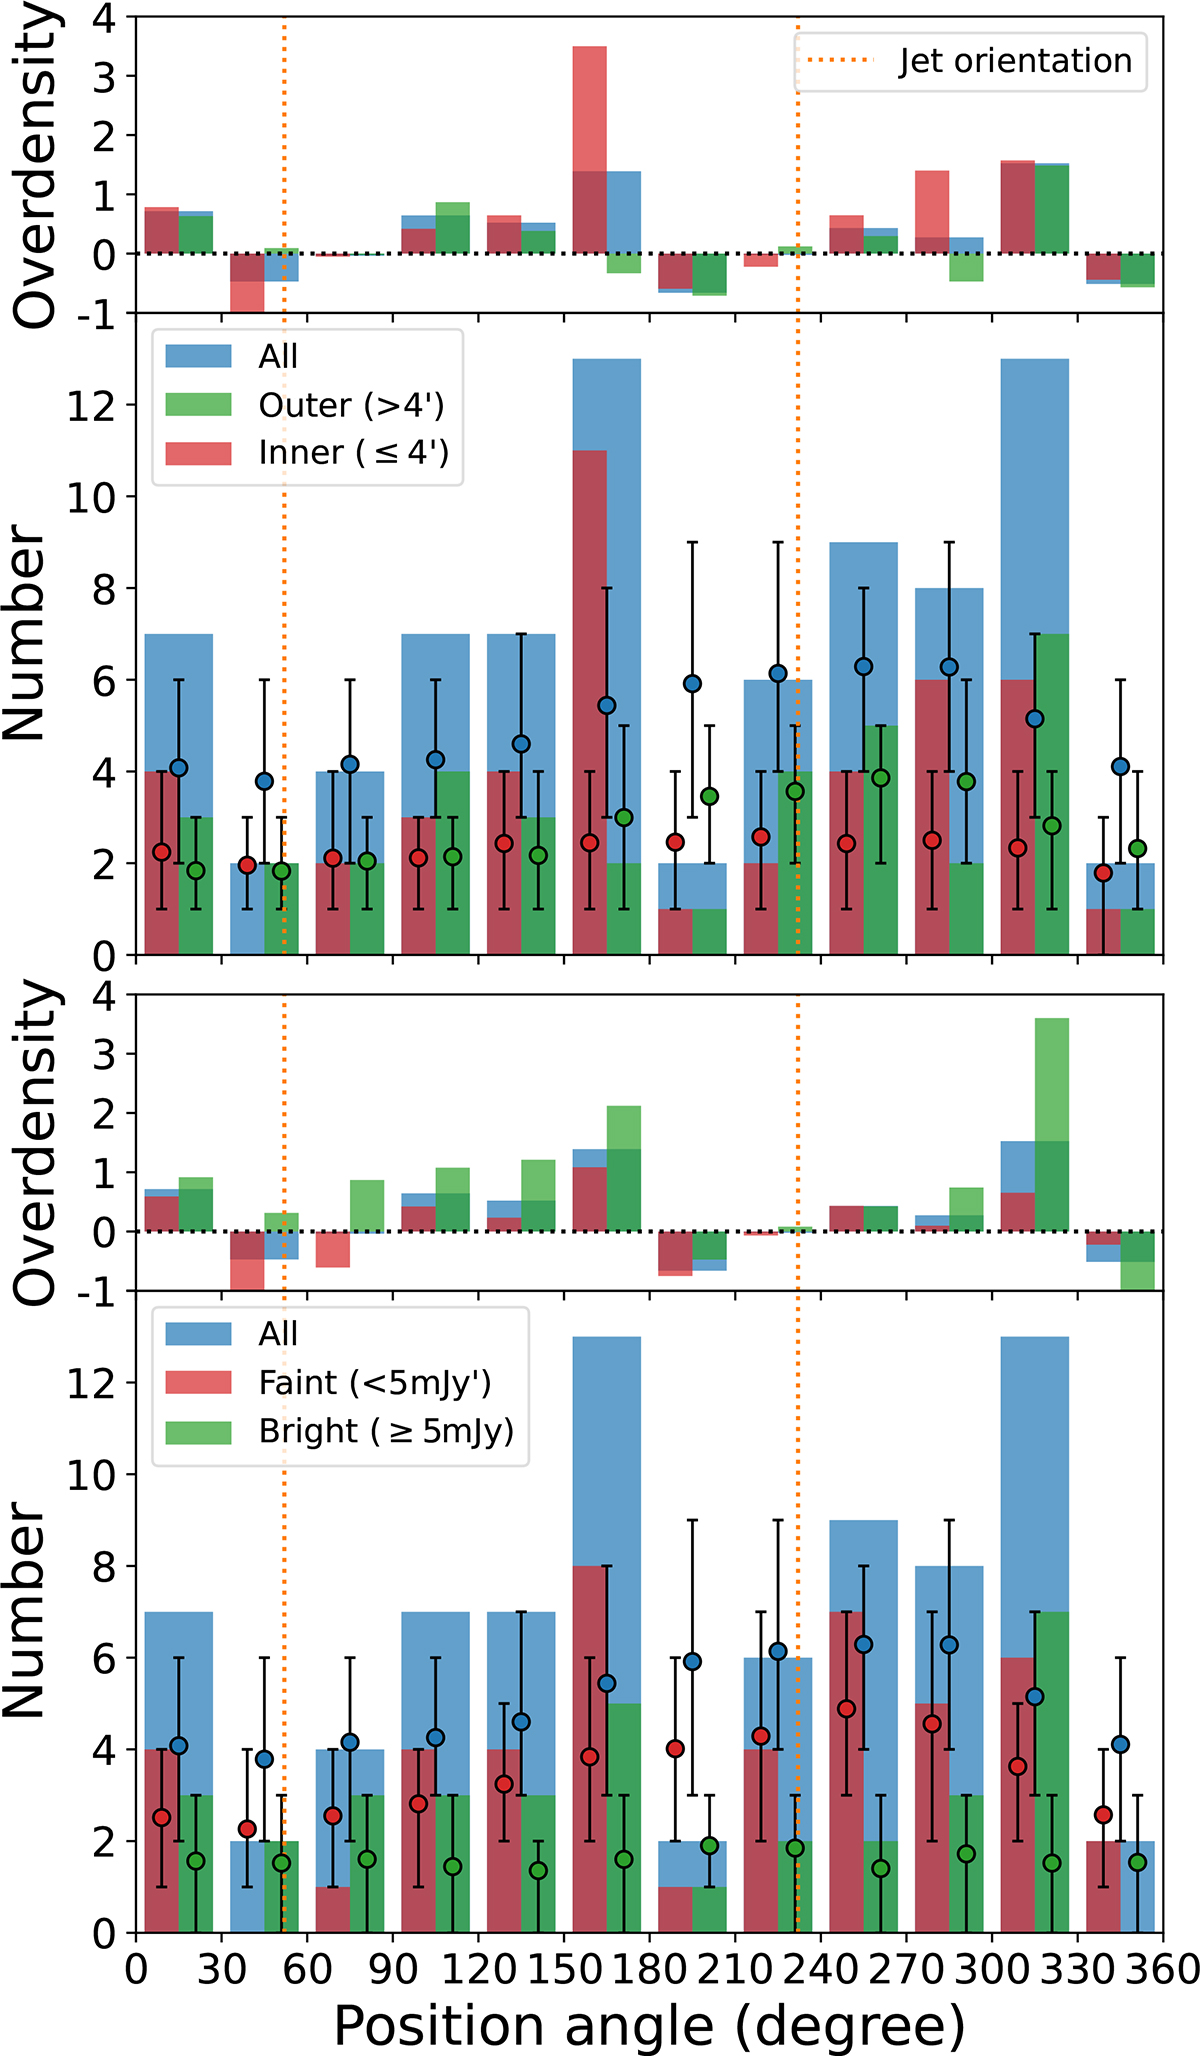
Fig. 11.
Download original image
Number distribution of SMGs as a function of the position angle. The fluctuation of the simulated SMG number is due to the asymmetric sensitivity of the SCUBA-2 data. The top panels in each plot show the corresponding overdensities as lines in the same colors. And the dashed orange lines indicate the rough direction of the radio jet. The angular dependence is depicted for both bright and faint SMGs in both inner and outer regions.
Current usage metrics show cumulative count of Article Views (full-text article views including HTML views, PDF and ePub downloads, according to the available data) and Abstracts Views on Vision4Press platform.
Data correspond to usage on the plateform after 2015. The current usage metrics is available 48-96 hours after online publication and is updated daily on week days.
Initial download of the metrics may take a while.