Fig. 10.
Download original image
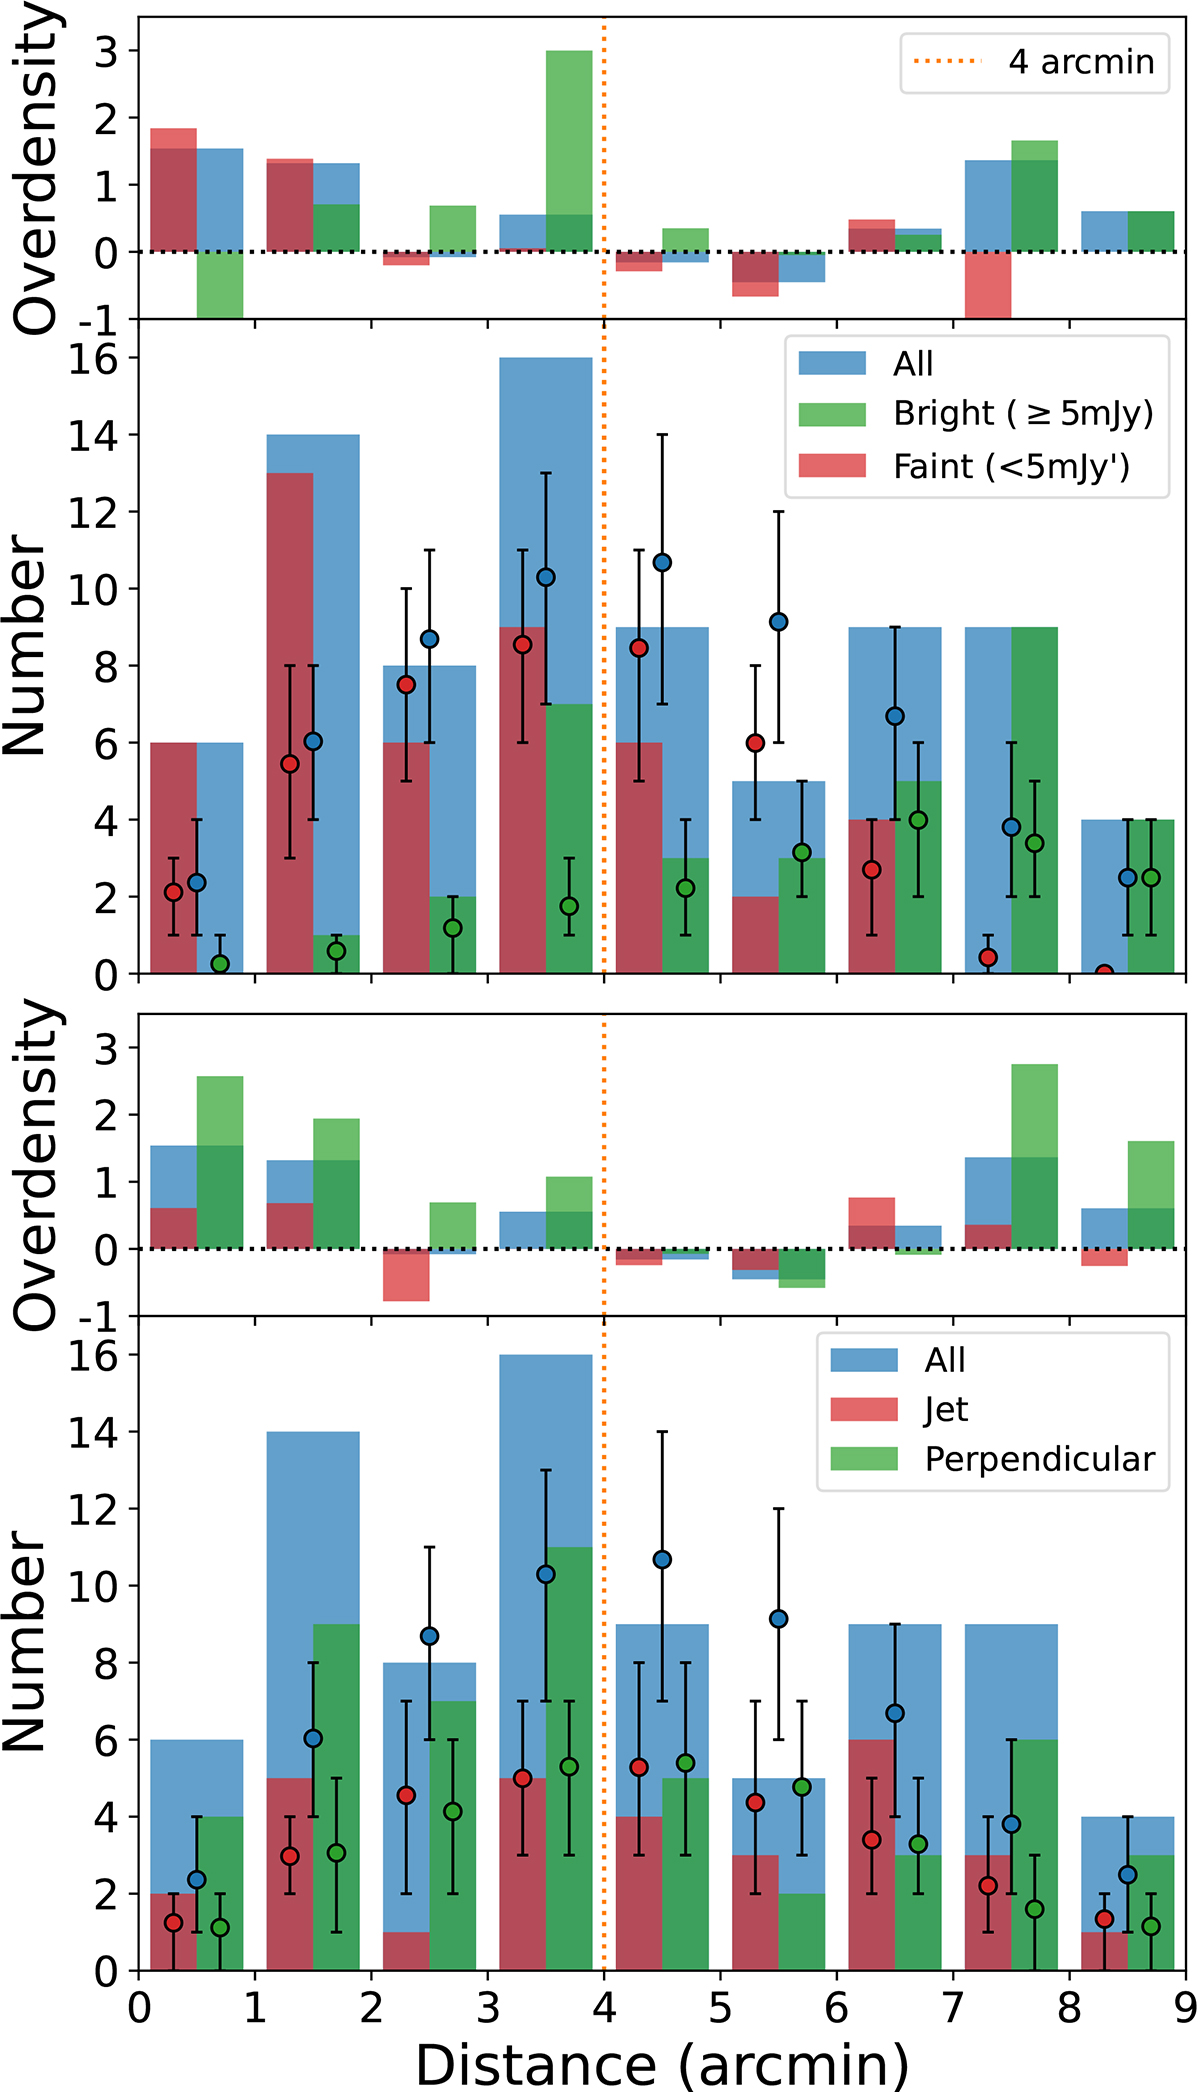
Number distribution of SMGs as a function of the radial distance to the center. The points with error bars are the expected numbers of SMGs from the blank field and the bars are the measured numbers in the field. The blue histogram shows the total number of SMGs within each bin. Top: SMG sample divided into bright (S850 μm ≥ 5 mJy; green) and faint (S850 μm < 5 mJy; red) subsamples. Bottom: SMG sample divided into jet (green) and perpendicular (red) region SMGs (see the schematics in Fig. 7). The corresponding overdensities are displayed as lines in the same colors. The faint SMGs show an excess within the central 2′, while overdensity of bright SMGs peaks at 3′≤r < 4′. Overdensity in jet region shows less dependence on the distance compared to the perpendicular region.
Current usage metrics show cumulative count of Article Views (full-text article views including HTML views, PDF and ePub downloads, according to the available data) and Abstracts Views on Vision4Press platform.
Data correspond to usage on the plateform after 2015. The current usage metrics is available 48-96 hours after online publication and is updated daily on week days.
Initial download of the metrics may take a while.