Fig. 9.
Download original image
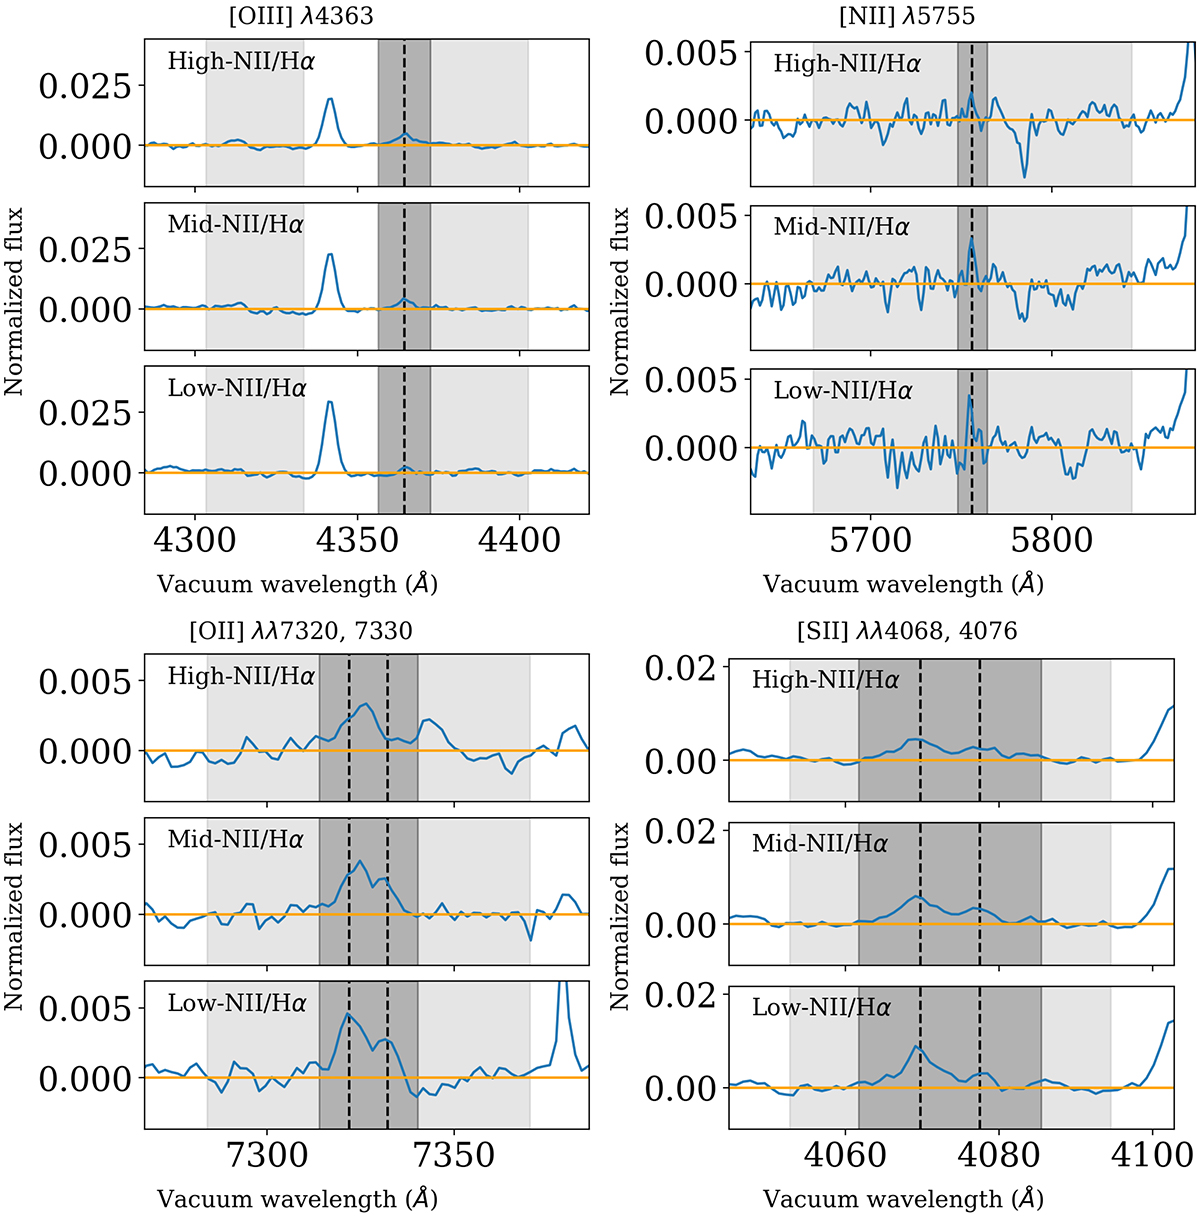
Spectra around the four targeted auroral lines corrected by the fit line derived from the sidebands. The dark gray region is the central region, the light gray regions are the sidebands, and the orange line denotes the zero value. [O III] λ4363 is on the top left, [N II] λ5755 is on the top right, [O II] λλ7320, 7330 is at the bottom left, and [S II] λλ4068, 4076 is at the bottom right.
Current usage metrics show cumulative count of Article Views (full-text article views including HTML views, PDF and ePub downloads, according to the available data) and Abstracts Views on Vision4Press platform.
Data correspond to usage on the plateform after 2015. The current usage metrics is available 48-96 hours after online publication and is updated daily on week days.
Initial download of the metrics may take a while.