Fig. 5.

Download original image
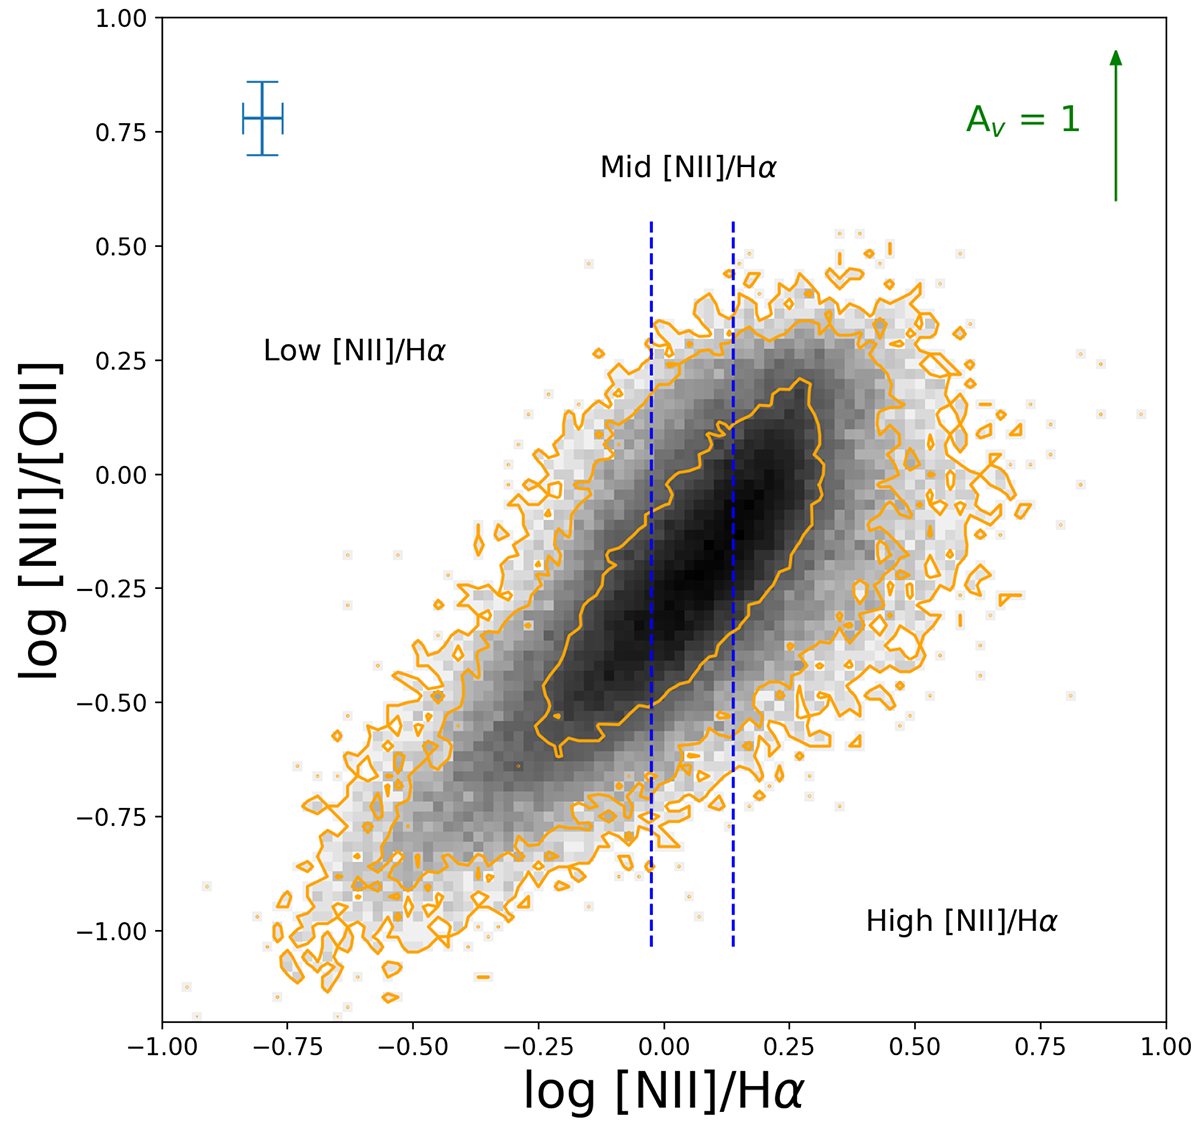
[N II]/[O II] vs. [N II]/Hα for all spaxels in the strong-line sample. Instead of a narrow sequence, there is noticeable scatter in this relation. The two blue dashed lines separate the spaxels into high, mid, and low [N II]/Hα bins. The data is meshed into 100 × 100 bins. The grayscale represents the density of all selected spaxels in each bin, while the orange contours enclose 68%, 95%, and 99% of the spaxels. The blue error bars in the top left corner denote the typical 1σ uncertainty of the line ratios. The extinction vector is given at the top right corner.
Current usage metrics show cumulative count of Article Views (full-text article views including HTML views, PDF and ePub downloads, according to the available data) and Abstracts Views on Vision4Press platform.
Data correspond to usage on the plateform after 2015. The current usage metrics is available 48-96 hours after online publication and is updated daily on week days.
Initial download of the metrics may take a while.


