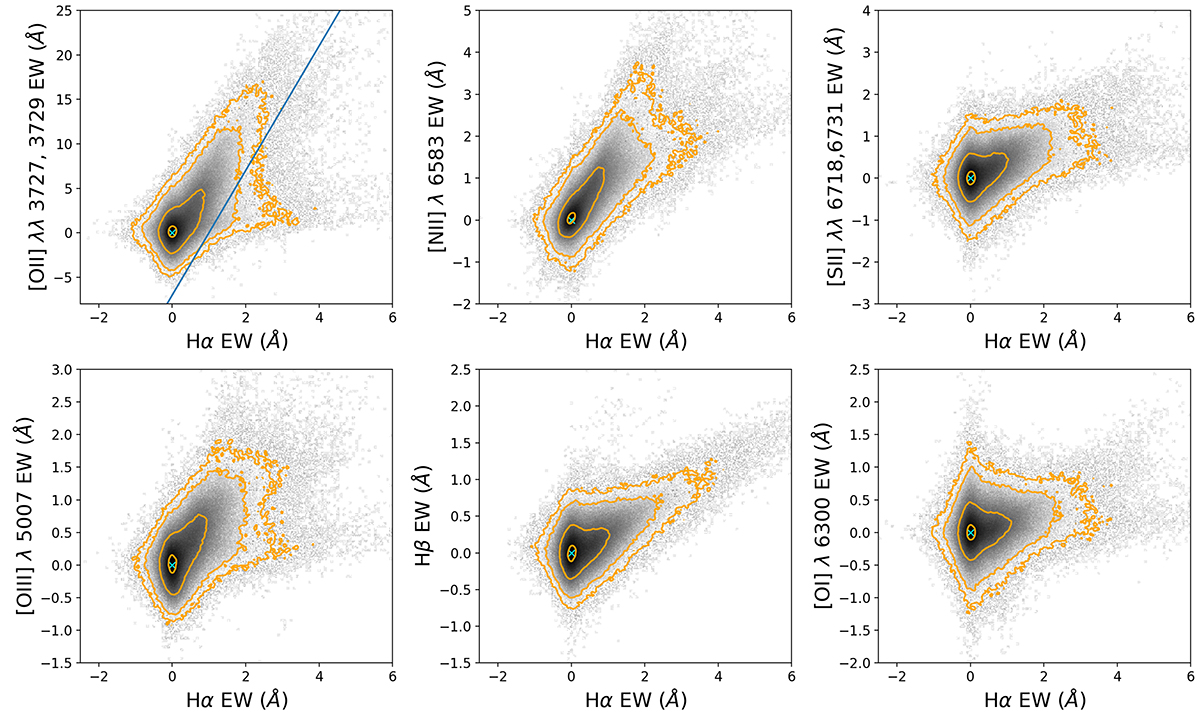
Fig. 3.
Download original image
Different strong-line EWs against Hα EW after zero point correction. The blue cross denotes the origin. The grayscale represents the density of the spaxels, while the orange contours enclose 10%, 68%, 95%, and 99% of the spaxels in each panel. The 10% contour is used to show that most of the data are centered at the zero value. The line in the first subplots represents the cut we applied to exclude contamination from transition objects and dusty star-forming galaxies. All spaxels on the right side of the line are removed from the next step.
Current usage metrics show cumulative count of Article Views (full-text article views including HTML views, PDF and ePub downloads, according to the available data) and Abstracts Views on Vision4Press platform.
Data correspond to usage on the plateform after 2015. The current usage metrics is available 48-96 hours after online publication and is updated daily on week days.
Initial download of the metrics may take a while.