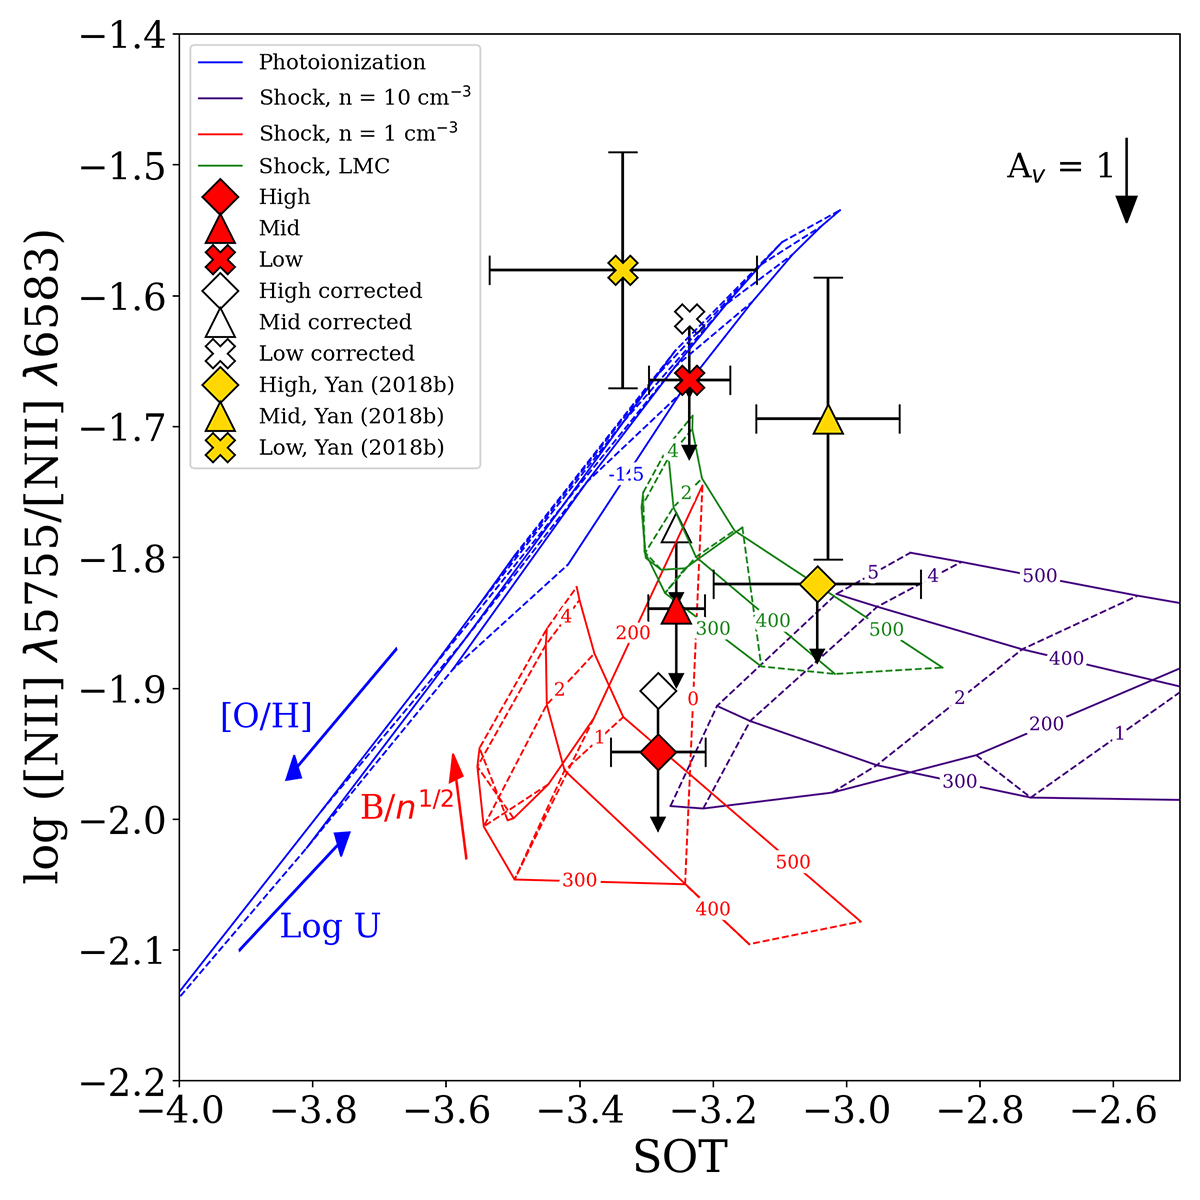
Fig. 14.
Download original image
log ([N II] λ6583/ Hα) vs. SOT. Both values are insensitive to dust, and therefore the extinction vector is not drawn. The error bars on the x-axis are also neglected as they are smaller than the marker and the error bars indicate 1σ uncertainties. All the grids are the same as those in Fig. 11. The blue photoionization grid predicts a lower SOT value compared to all of the data points. All of the data support the interstellar shock models. However, the actual shock parameters cannot be tightly constrained due to the uncertainty in metallicity and pre-shock density.
Current usage metrics show cumulative count of Article Views (full-text article views including HTML views, PDF and ePub downloads, according to the available data) and Abstracts Views on Vision4Press platform.
Data correspond to usage on the plateform after 2015. The current usage metrics is available 48-96 hours after online publication and is updated daily on week days.
Initial download of the metrics may take a while.