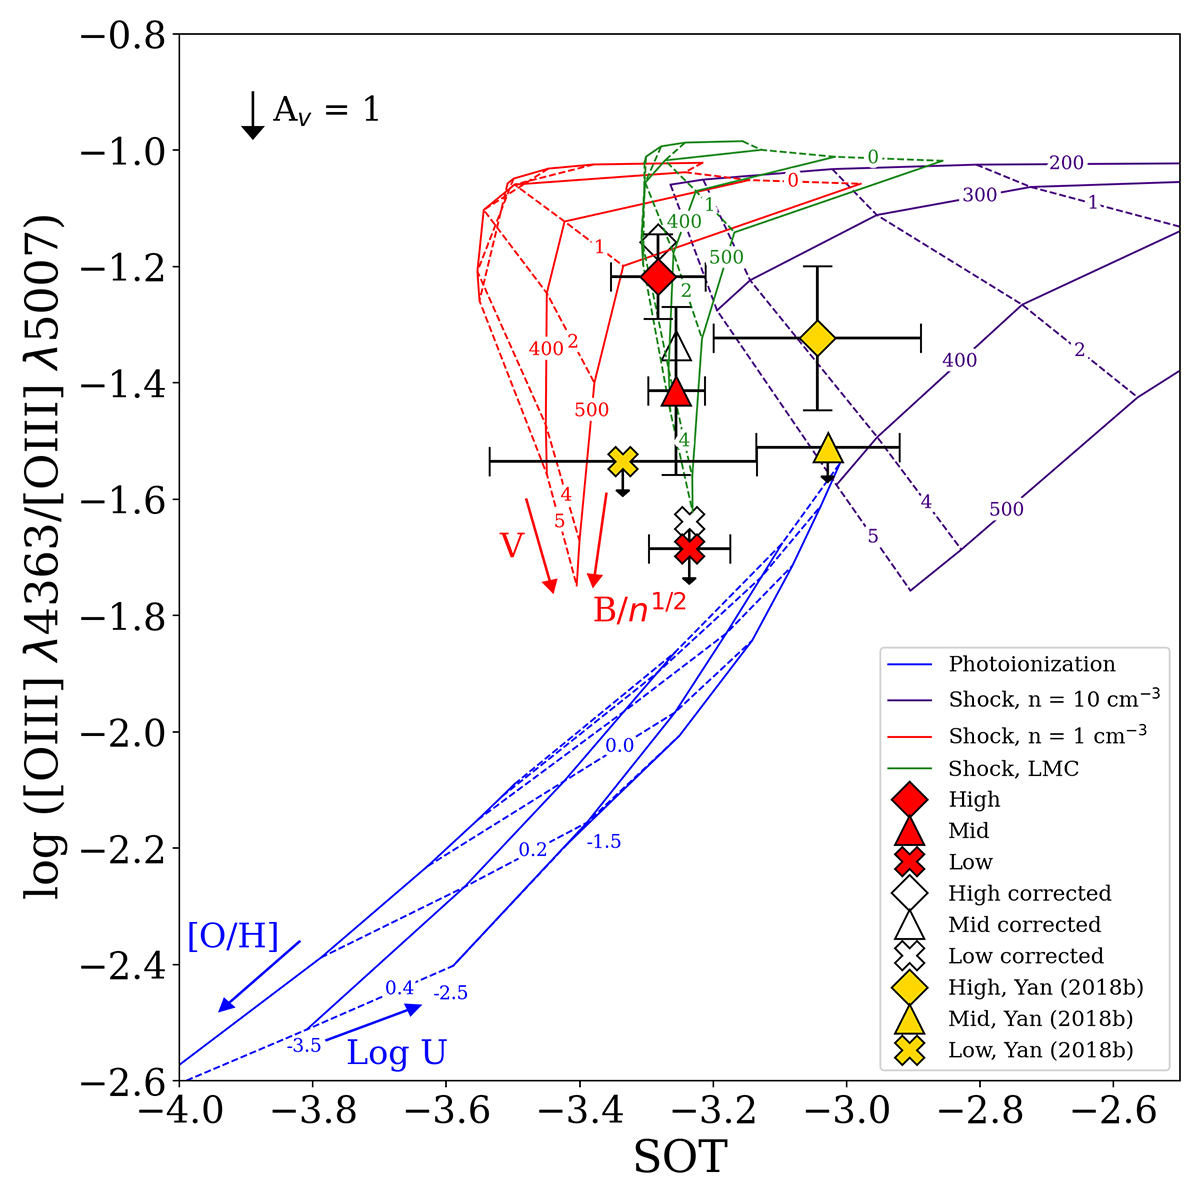
Fig. 13.
Download original image
log ([N II] λ5755/ [N II] λ6583) vs. SOT. The error bars, the grids, and the black arrow are the same as those in Fig. 11. The dust extinction corrected data points are in white. These corrections could be significant overcorrections for the low-ionization lines (see text). For undetected lines, the upper limits are denoted by arrows and are calculated using the 2σ flux values.
Current usage metrics show cumulative count of Article Views (full-text article views including HTML views, PDF and ePub downloads, according to the available data) and Abstracts Views on Vision4Press platform.
Data correspond to usage on the plateform after 2015. The current usage metrics is available 48-96 hours after online publication and is updated daily on week days.
Initial download of the metrics may take a while.