Fig. 11.
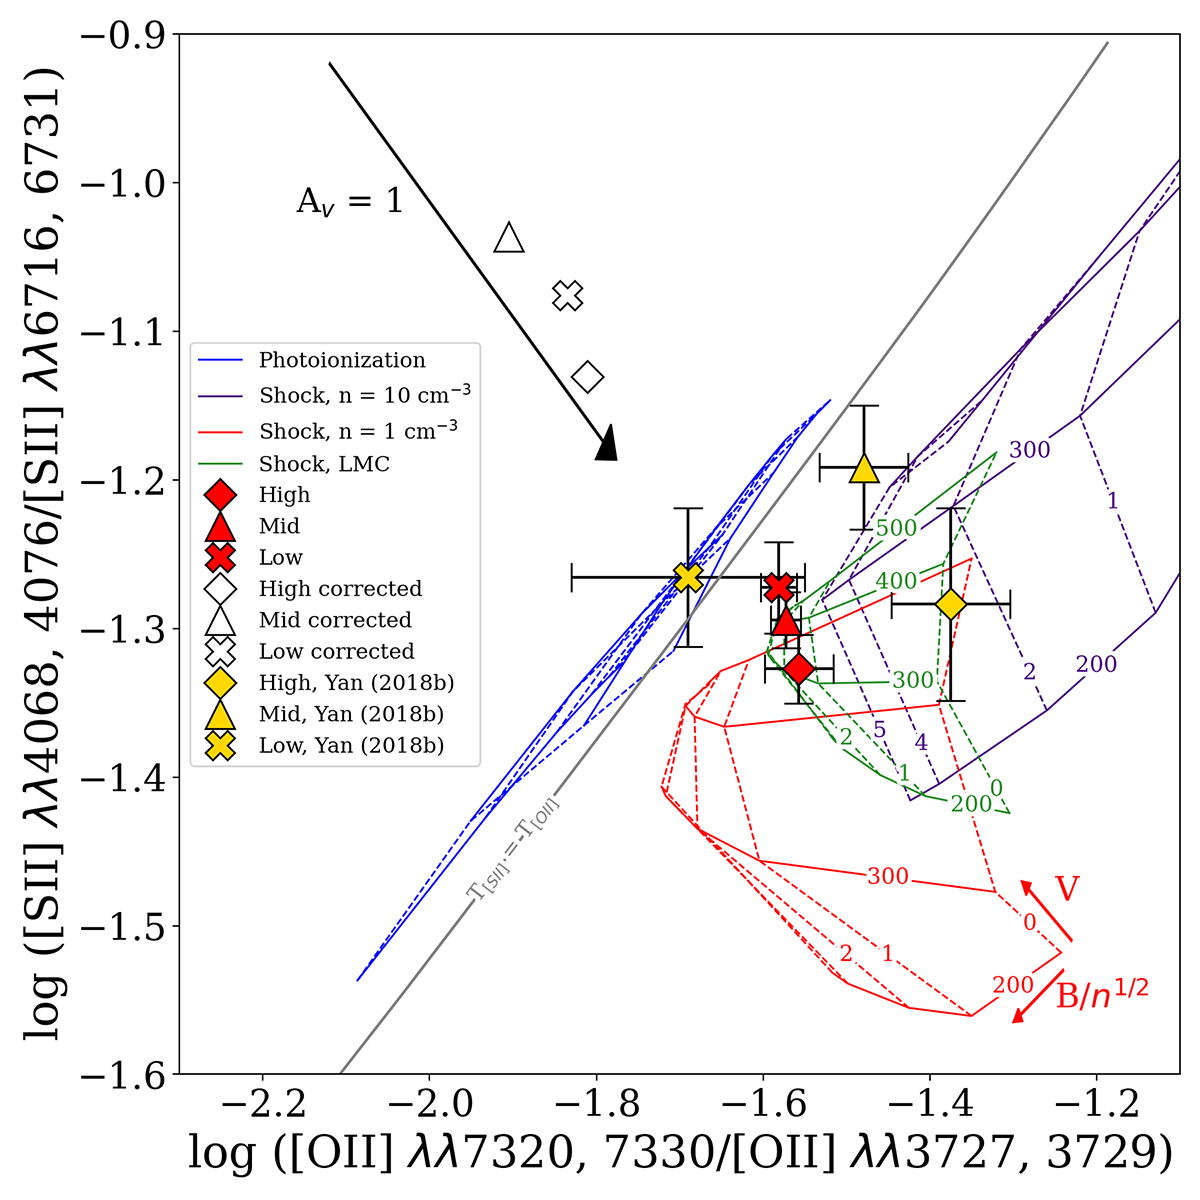
Download original image
log ([S II] λλ4068, 4076/ [S II] λλ6716, 6731) vs. log ([O II] λλ7320, 7330/ [O II] λλ3727, 3729). All the data points are plotted with error bars indicating 1σ uncertainty. The blue grid is the photoionization model and the other three grids are the shock models. The indigo grid has a pre-shock density of n = 10 cm−3 and solar metallicity. The red grid has a pre-shock density of n = 1 cm−3 and solar metallicity. The green grid has a pre-shock density of n = 1 cm−3 and sub-solar LMC metallicity. The black arrow represents the effect of 1 mag extinction in AV. Extinction correction using the coefficient predicted by the Balmer decrement will move the data points to the locations indicated by the white data points, which cannot be explained by any model and current understanding of ISM. Therefore, the correction may not be physical. The gray line represents the line ratios when the temperature measured by [S II] is the same as [O II].
Current usage metrics show cumulative count of Article Views (full-text article views including HTML views, PDF and ePub downloads, according to the available data) and Abstracts Views on Vision4Press platform.
Data correspond to usage on the plateform after 2015. The current usage metrics is available 48-96 hours after online publication and is updated daily on week days.
Initial download of the metrics may take a while.