Fig. 1.
Download original image
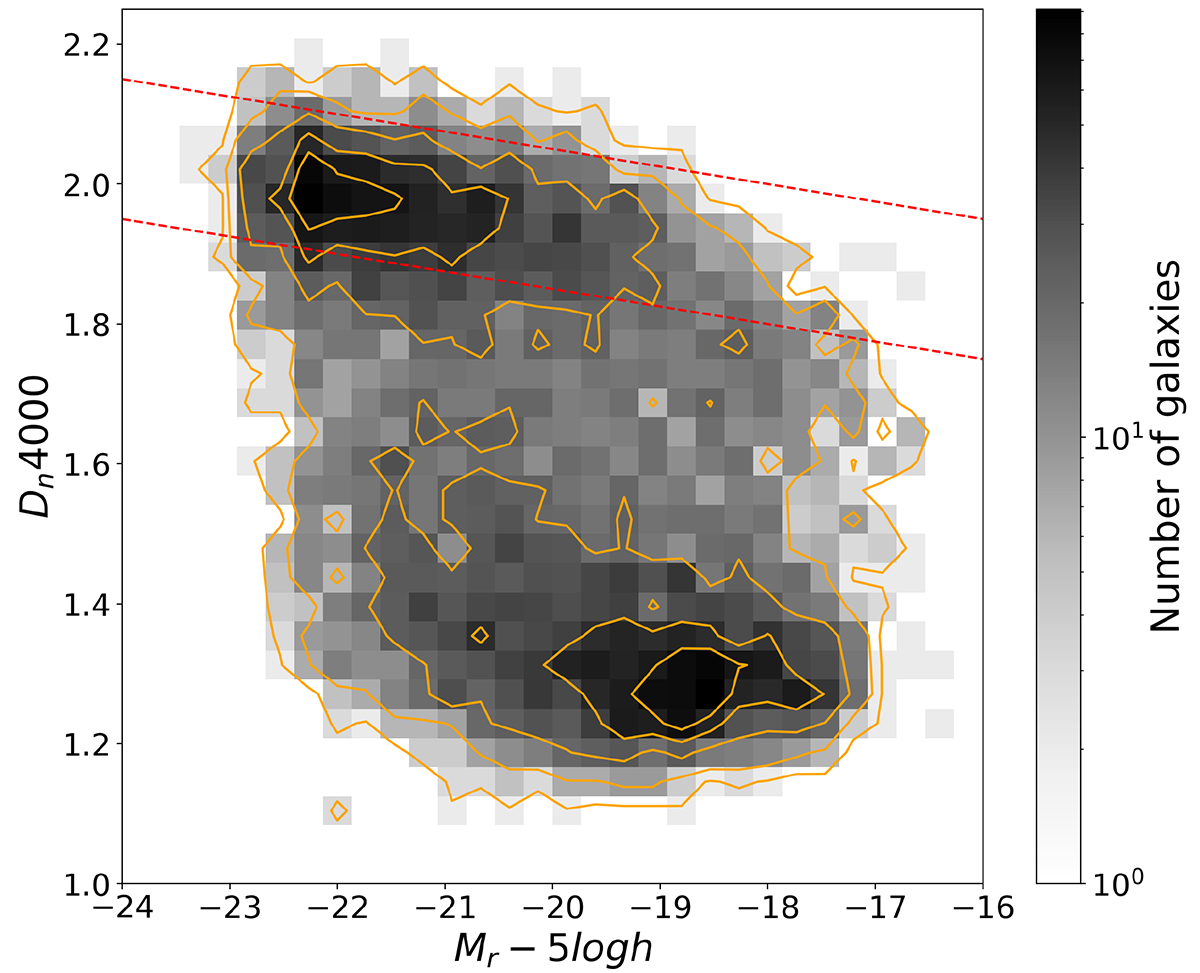
Dn4000 vs. absolute magnitude in the r band. The values of Dn4000 are from the MaNGA DAP and the absolute magnitudes in the r band are from the NSA catalogue. The gray region shows the density distribution of all galaxies, while the orange contours are drawn at 10%, 30%, 68%, 95%, and 99% of all galaxies. Galaxies between the red dashed lines are selected as our quiescent galaxy sample. Galaxies with invalid Mr and Dn4000 are not plotted.
Current usage metrics show cumulative count of Article Views (full-text article views including HTML views, PDF and ePub downloads, according to the available data) and Abstracts Views on Vision4Press platform.
Data correspond to usage on the plateform after 2015. The current usage metrics is available 48-96 hours after online publication and is updated daily on week days.
Initial download of the metrics may take a while.