Fig. 8.
Download original image
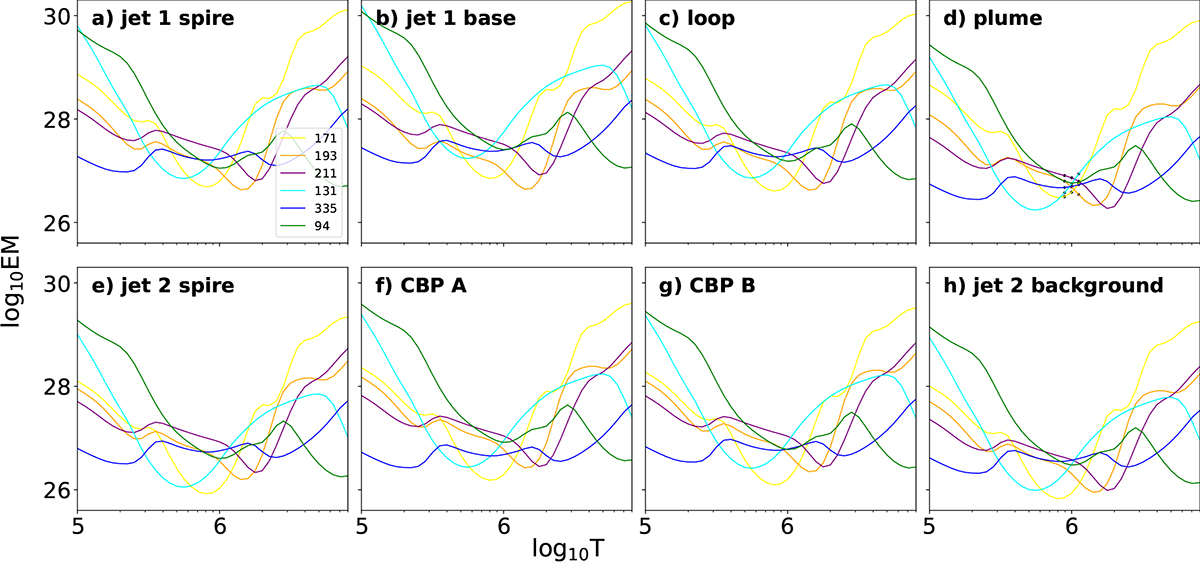
EM-loci curves of the two areas. EM and temperature (T) are measured in cm3 and K, respectively. The top row corresponds to jet 1, and shows the jet spire (panel a), the jet base (panel b), a region on the loop (panel c), and the plume emission (panel d) at 17:27 UT. The bottom row corresponds to jet 2, and shows the spire (panel e), two regions on the coronal bright point (panels f and g), and the background (panel h) at 17:08 UT. The black dots in panel (d) correspond to the points around each minimum where each EM curve is in closest proximity with the others.
Current usage metrics show cumulative count of Article Views (full-text article views including HTML views, PDF and ePub downloads, according to the available data) and Abstracts Views on Vision4Press platform.
Data correspond to usage on the plateform after 2015. The current usage metrics is available 48-96 hours after online publication and is updated daily on week days.
Initial download of the metrics may take a while.