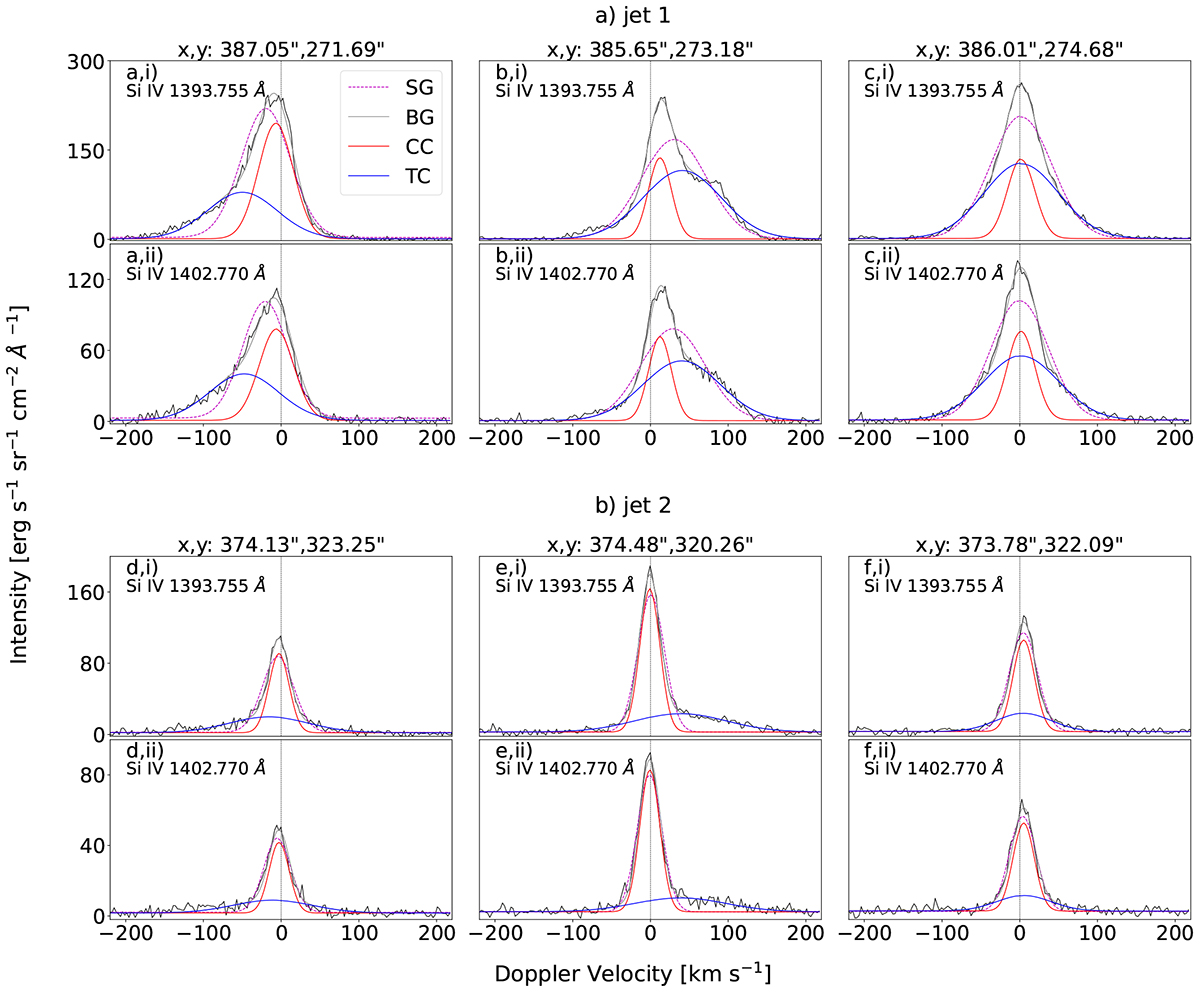
Fig. 6.
Download original image
Characteristic Si IV 1393.755 Å and 1402.770 Å profiles of jet 1 (top subfigure) and jet 2 (bottom subfigure). The x-axis is the Doppler velocity in km/s and the y-axis is the intensity in erg s−1 sr−1 cm−2 Å−1. In each panel, the red dashed line is the single Gaussian curve, the gray solid line is the bimodal Gaussian curve, and the red and blue solid lines are the core component and tail component curves, respectively. For each jet subfigure, the first row shows Si IV 1393.755 Å profiles and the second row shows the respective Si IV 1402.770 Å profiles. The profile spatial position in arcseconds is indicated at the top of the Si IV 1393.755 Å panels.
Current usage metrics show cumulative count of Article Views (full-text article views including HTML views, PDF and ePub downloads, according to the available data) and Abstracts Views on Vision4Press platform.
Data correspond to usage on the plateform after 2015. The current usage metrics is available 48-96 hours after online publication and is updated daily on week days.
Initial download of the metrics may take a while.