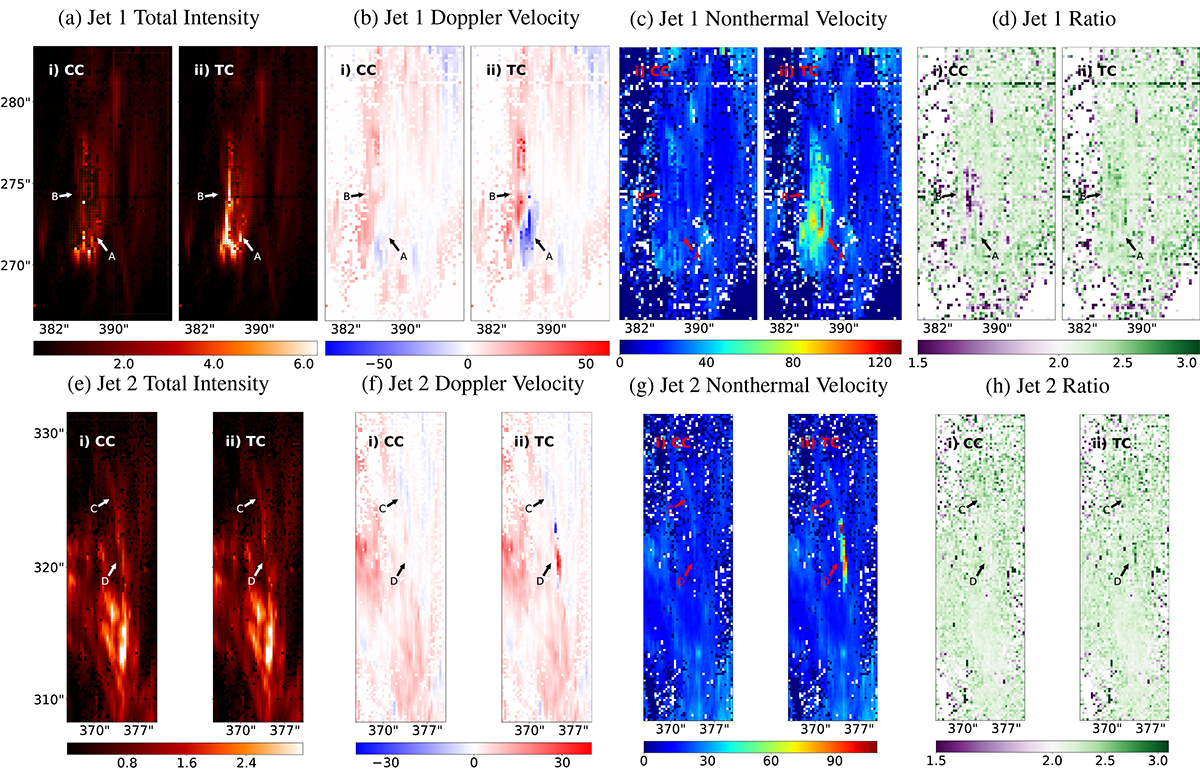
Fig. 5.
Download original image
Maps of Doppler velocity in km/s, nonthermal velocity in km/s, total linear intensity in 103× erg s−1 sr−1 cm−2, and the 1393.755 Å/1402.770 Å ratio of jet 1 (top 4 panels) and jet 2 (bottom 4 panels). The values are derived from the single Gaussian fit of the Si IV 1393.755 Å spectral line, except the locations where profiles are best described by a bimodal Gaussian fit and shown in green in panels a and b. In the left panel of each subfigure, the values of the green-marked pixels are those of the core component (marked CC) of the bimodal Gaussian fit, while in the right panel these values indicate those of the tail component (marked TC). The gray boxes in panels (a) and (e) show the regions that we define as background in Section 3.4. Lastly, the arrows show the position of the jet 1 base (arrow A), the loop associated with jet 1 (B), the jet 2 spire (C), and jet 2 base (D).
Current usage metrics show cumulative count of Article Views (full-text article views including HTML views, PDF and ePub downloads, according to the available data) and Abstracts Views on Vision4Press platform.
Data correspond to usage on the plateform after 2015. The current usage metrics is available 48-96 hours after online publication and is updated daily on week days.
Initial download of the metrics may take a while.