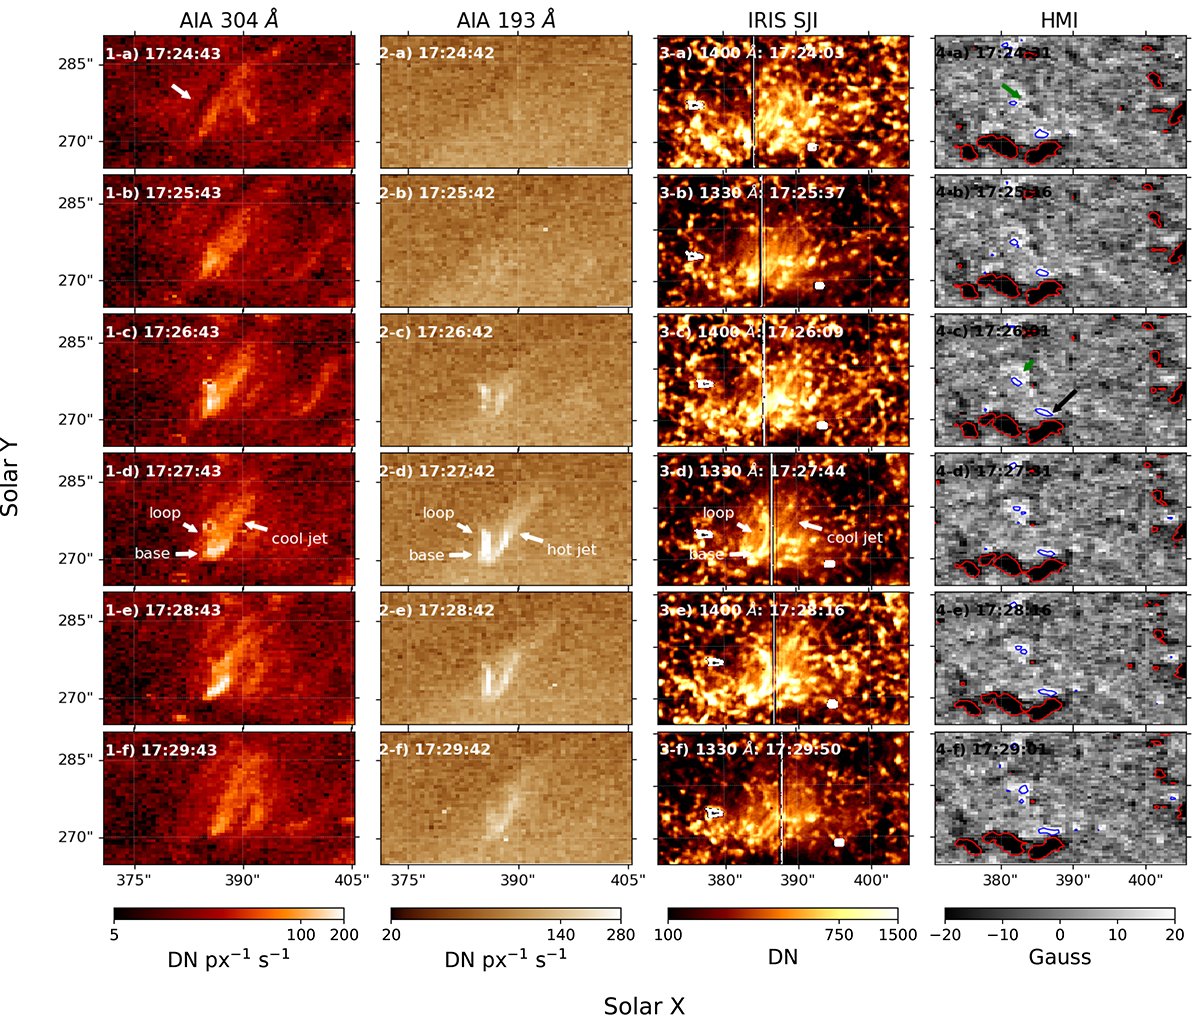
Fig. 3.
Download original image
Temporal evolution of Jet 1. Columns 1 to 4 show AIA 304 Å and 193 Å, SJ 1330 Å and 1400 Å, and HMI magnetogram images, respectively. Time evolves from 17:24 UT (first row) to 17:29 UT (last row). The arrows in panels 1-d, 2-d and 3-d indicate the location of the loop and the jet under study. In panels 4-a to 4-f, the red and blue contours indicate regions with strengths of –20 G and 20 G, respectively. The white arrow in panel 1-a shows the position of the mini-filament (see text for more details) and the corresponding green arrow in panel 4-a indicates the underlying polarity inversion line.
Current usage metrics show cumulative count of Article Views (full-text article views including HTML views, PDF and ePub downloads, according to the available data) and Abstracts Views on Vision4Press platform.
Data correspond to usage on the plateform after 2015. The current usage metrics is available 48-96 hours after online publication and is updated daily on week days.
Initial download of the metrics may take a while.