Fig. C.1.
Download original image
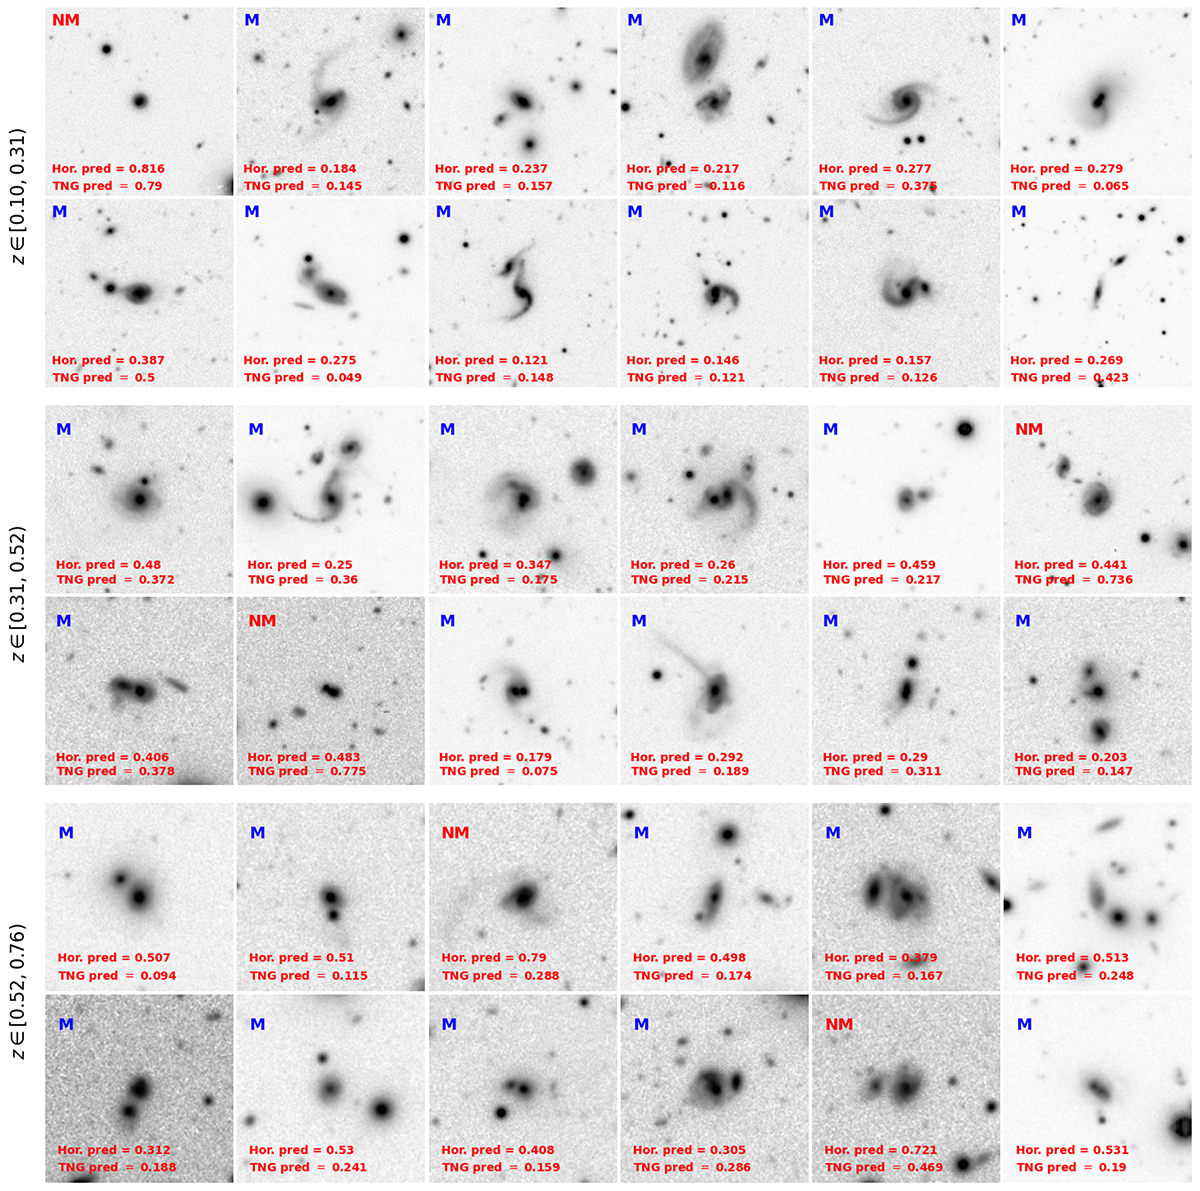
Example HSC i-band cutouts of the visually classified mergers (z-bin 1: the first two rows; z-bin 2: the third and fourth row; z-bin 3: the last two rows). At the bottom of each image, we report the predictions from the TNG-CNN and Horizon-CNN. At the top of each image, we list the predicted class according to our final classification (Comb-CNN with two thresholds). The blue ’M’ indicates mergers, while the red ’NM’ indicates non-mergers. The images have an approximate physical size of 160 kpc, resized to 160 × 160 pixels and displayed with an arcsinh greyscale.
Current usage metrics show cumulative count of Article Views (full-text article views including HTML views, PDF and ePub downloads, according to the available data) and Abstracts Views on Vision4Press platform.
Data correspond to usage on the plateform after 2015. The current usage metrics is available 48-96 hours after online publication and is updated daily on week days.
Initial download of the metrics may take a while.