Fig. 11.
Download original image
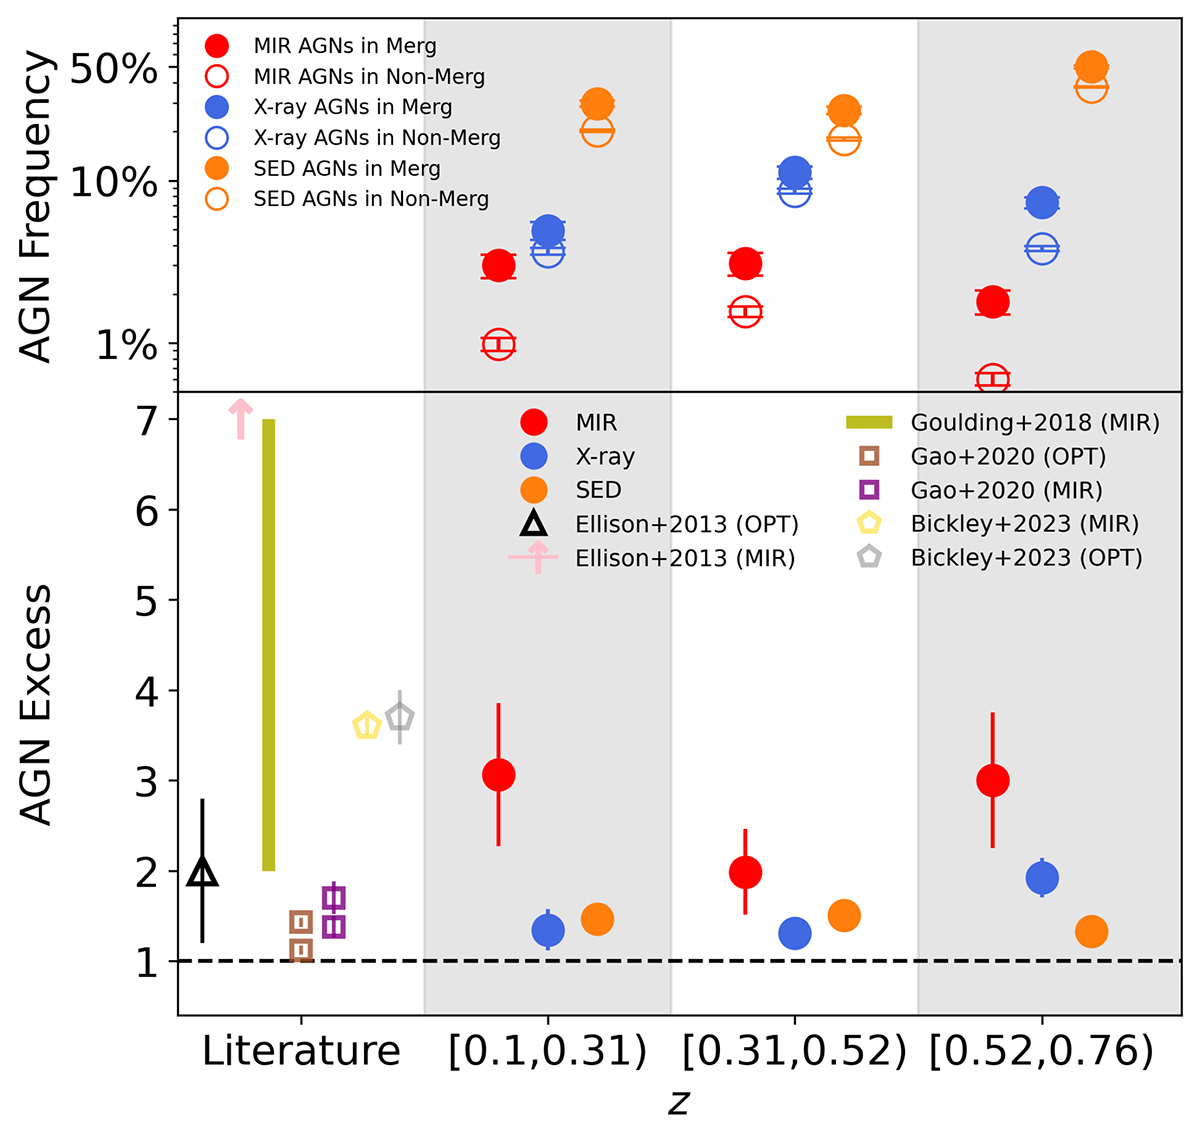
AGN frequency in mergers vs non-mergers. Top: Frequency of AGNs (MIR AGN: red; X-ray AGN: blue; SED AGN: orange) in mergers (filled symbols) and non-mergers (empty symbols) per z-bin. Errors are calculated using binomial statistics. Bottom: Ratio of AGN frequency in mergers relative to that in non-mergers (i.e. AGN excess). The dashed line indicates no excess. Previous measurements are shown on the left. Ellison et al. (2013) found a MIR AGN excess of 13.3, shown as an arrow for readability.
Current usage metrics show cumulative count of Article Views (full-text article views including HTML views, PDF and ePub downloads, according to the available data) and Abstracts Views on Vision4Press platform.
Data correspond to usage on the plateform after 2015. The current usage metrics is available 48-96 hours after online publication and is updated daily on week days.
Initial download of the metrics may take a while.