Fig. 9.
Download original image
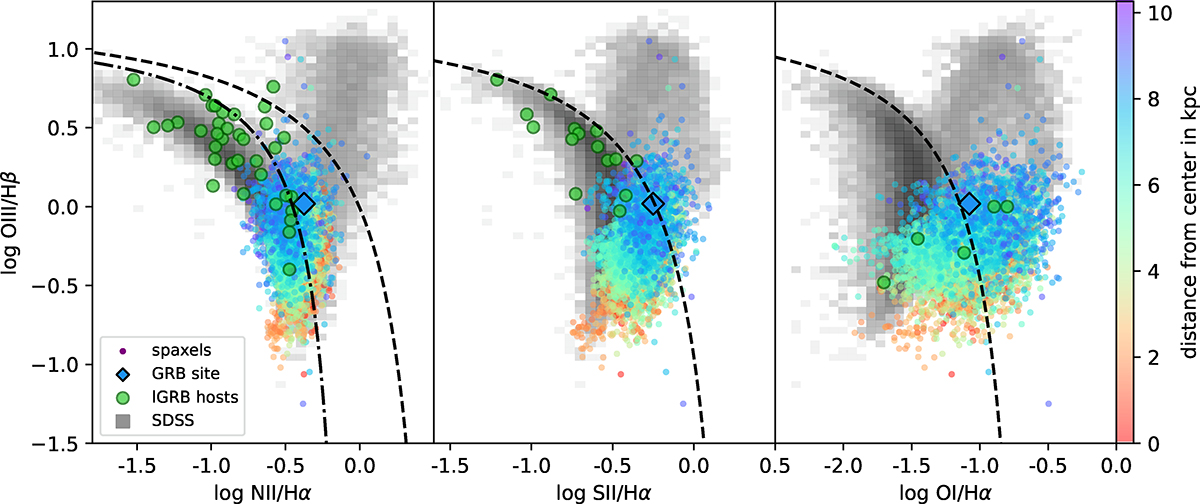
BPT diagrams using [N II]/Hα, [S II]/Hα and [O I]/Hα for individual spaxels compared to the values for other long GRB hosts (green dots) and star forming galaxies in the SDSS (gray grid). The spaxels are color coded by their deprojected distance from the galaxy center as shown in the color bar. The value of the GRB site (color coded by its distance) is shown as a diamond. Emission lines for the GRB sample have been obtained from the same data used in Fig. 18. We only plot spaxels with EW < −6 Å to remove diffuse interstellar gas (DIG) as explained in the text.
Current usage metrics show cumulative count of Article Views (full-text article views including HTML views, PDF and ePub downloads, according to the available data) and Abstracts Views on Vision4Press platform.
Data correspond to usage on the plateform after 2015. The current usage metrics is available 48-96 hours after online publication and is updated daily on week days.
Initial download of the metrics may take a while.