Fig. 8.
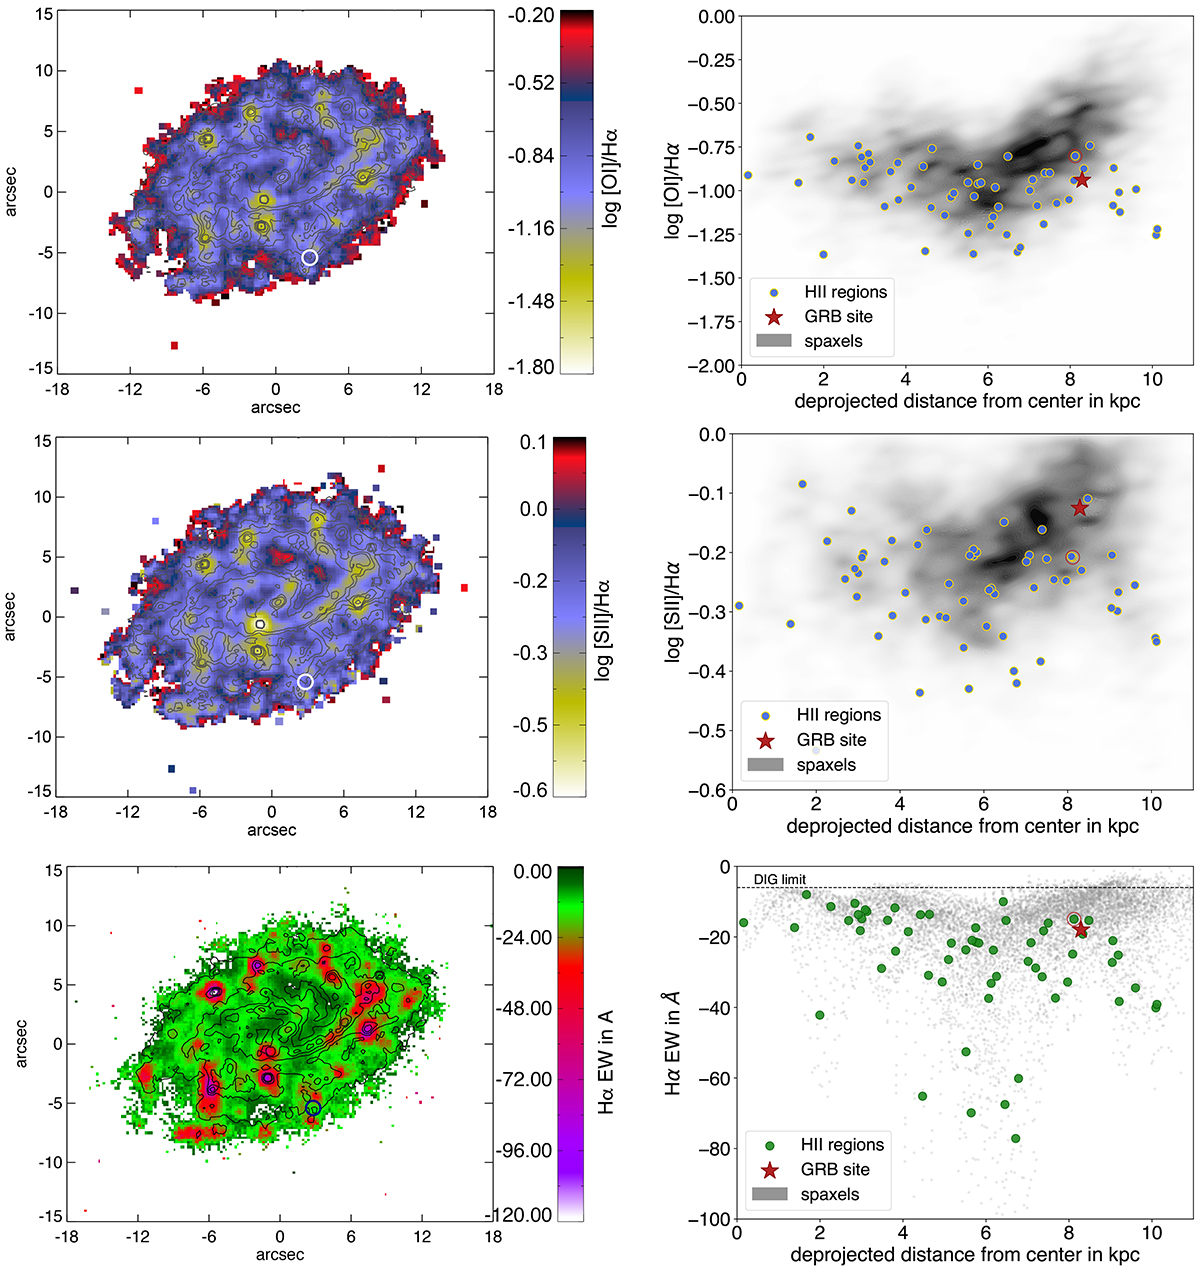
Download original image
Maps and deprojected properties of [O I]/Hα, [S II]/Hα and the Hα EW. First row: [O I]/Hα. Second row: log10 [S II]/Hα, indicative of shocked regions. Third row: Hα EW, the EW at the GRB site is only a lower limit due to the contamination of the continuum by the GRB-SN. The dashed line indicates the cut in EW applied to account for possible emission from diffuse ionized gas (see Sect. 6.1).
Current usage metrics show cumulative count of Article Views (full-text article views including HTML views, PDF and ePub downloads, according to the available data) and Abstracts Views on Vision4Press platform.
Data correspond to usage on the plateform after 2015. The current usage metrics is available 48-96 hours after online publication and is updated daily on week days.
Initial download of the metrics may take a while.