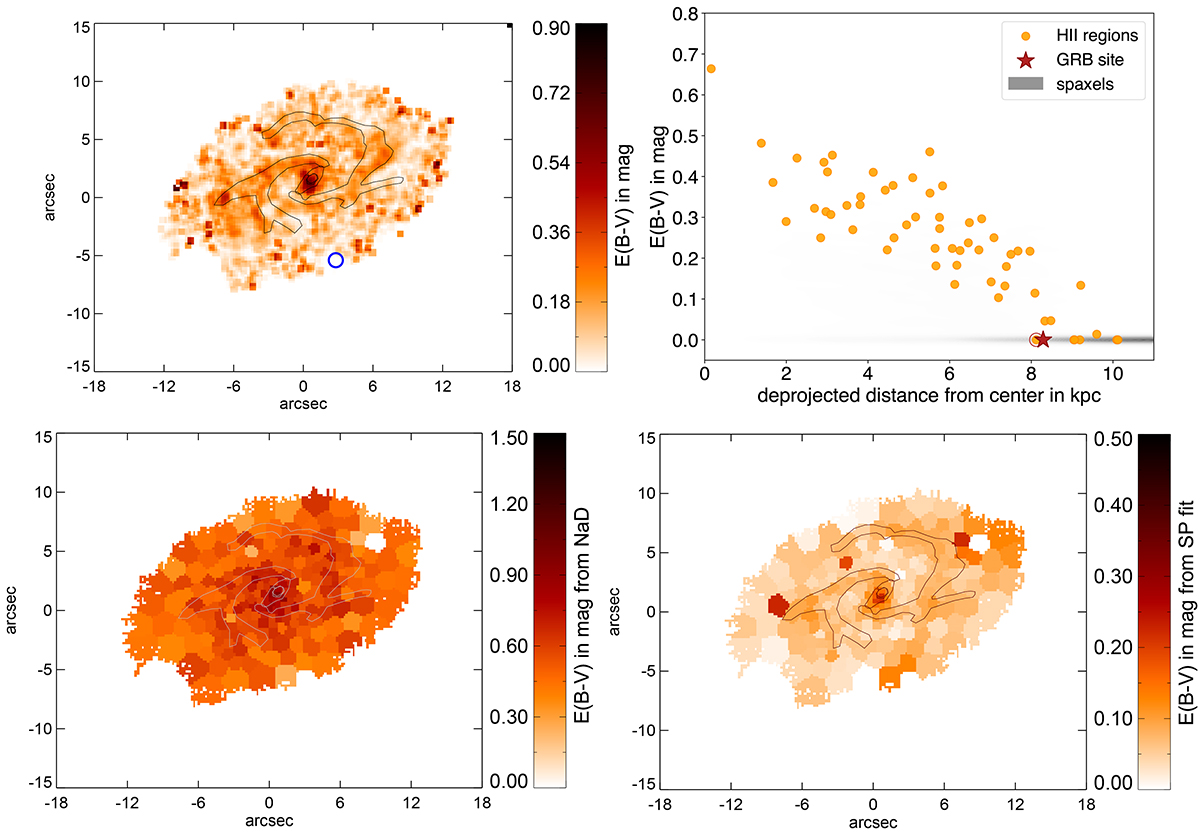
Fig. 6.
Download original image
Maps and deprojected properties of the extinction in the host, derived from different measurements. Top panels: E(B − V) determined from the Balmer decrement after correcting Hα and Hβ for stellar absorption. Bottom left panel: Extinction map using the correlation between the NaD EW and extinction from Poznanski et al. (2012). Bottom right panel: Extinction map from the stellar population fitting. The maps at the bottom were obtained from the Voronoi binned cube; the white region is a bin affected by a foreground star and has been omitted. Overplotted contours are derived from the ALMA CO(1−0) map (see de Ugarte Postigo et al. 2024).
Current usage metrics show cumulative count of Article Views (full-text article views including HTML views, PDF and ePub downloads, according to the available data) and Abstracts Views on Vision4Press platform.
Data correspond to usage on the plateform after 2015. The current usage metrics is available 48-96 hours after online publication and is updated daily on week days.
Initial download of the metrics may take a while.