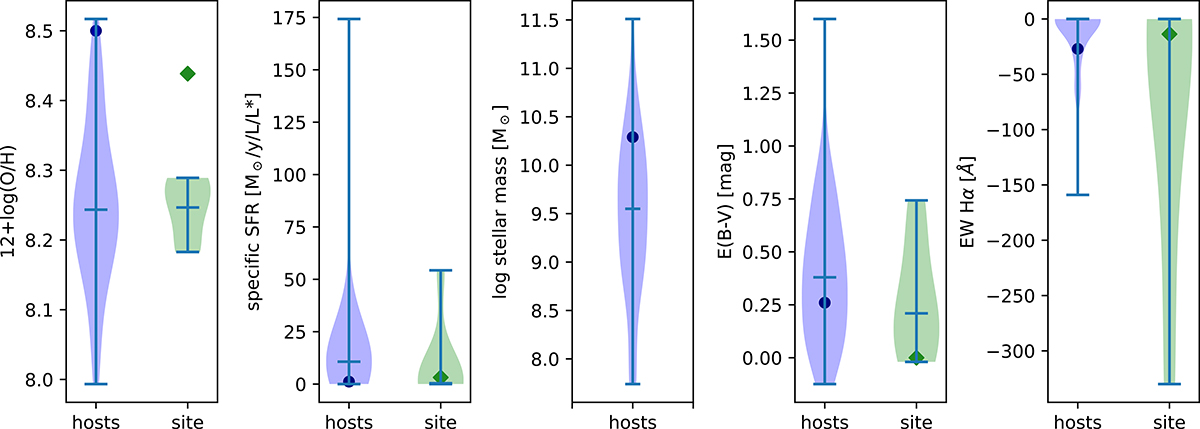
Fig. 18.
Download original image
Violin plots of different properties of global/integrated GRB host spectra (blue plots) and the same properties at the resolved GRB sites (green plots). The dots are the global values for the host of GRB 171205A, diamonds are the values at the GRB site of GRB 171205A. Emission lines for the integrated host spectra were obtained from the samples of Krühler et al. (2015), Han et al. (2010), with additional single GRBs from Della Valle et al. (2006), Christensen et al. (2008), Kelly et al. (2013), Schulze et al. (2014), Thöne et al. (2014), Izzo et al. (2017), Heintz et al. (2018), Cano et al. (2017b), de Ugarte Postigo et al. (2018, 2020), Melandri et al. (2019). Stellar masses were taken from the GHostS database (http://www.grbhosts.org) and Palmerio et al. (2019). Rest-frame B-band magnitudes to derive the sSFR were taken from the TOUGH sample (Hjorth et al. 2012) and Krühler et al. (2011). Hα EW were determined from public spectra stored in the GRBspec database (de Ugarte Postigo et al. 2014b). The values for the GRB sites were taken from Christensen et al. (2008), Thöne et al. (2014), Izzo et al. (2017), Cano et al. (2017b), de Ugarte Postigo et al. (2018), Melandri et al. (2019).
Current usage metrics show cumulative count of Article Views (full-text article views including HTML views, PDF and ePub downloads, according to the available data) and Abstracts Views on Vision4Press platform.
Data correspond to usage on the plateform after 2015. The current usage metrics is available 48-96 hours after online publication and is updated daily on week days.
Initial download of the metrics may take a while.