Fig. 17.
Download original image
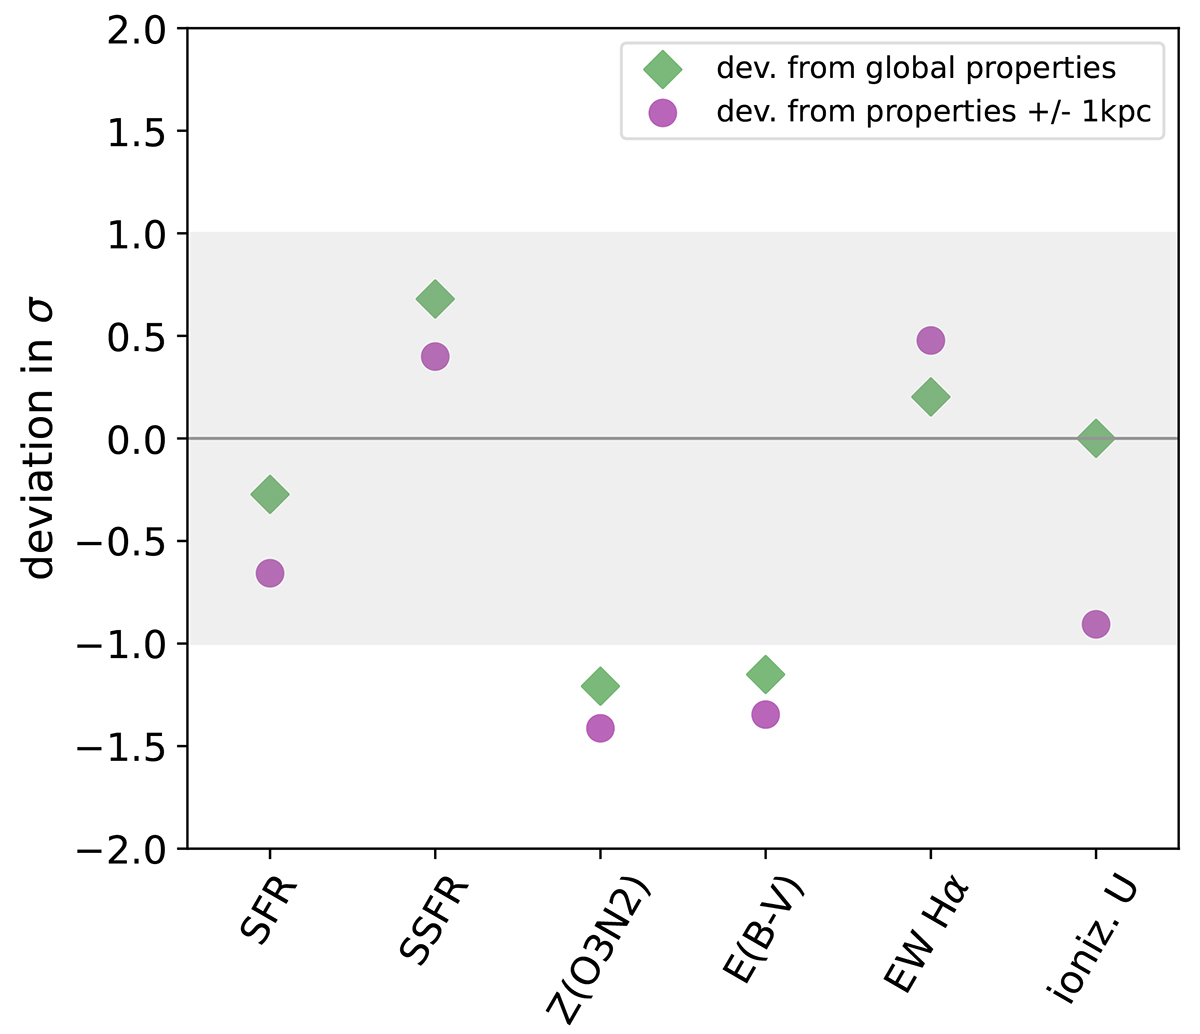
Deviation in standard deviation σ of different properties in the GRB H II region compared to the mean value in the host (green diamonds) and compared to a bin of ±1 kpc around distance of the GRB (8 kpc, magenta dots). The SFR is determined as SFR/spaxel to account for the fact that the spectrum of the GRB HII region was integrated over several spaxels.
Current usage metrics show cumulative count of Article Views (full-text article views including HTML views, PDF and ePub downloads, according to the available data) and Abstracts Views on Vision4Press platform.
Data correspond to usage on the plateform after 2015. The current usage metrics is available 48-96 hours after online publication and is updated daily on week days.
Initial download of the metrics may take a while.