Open Access
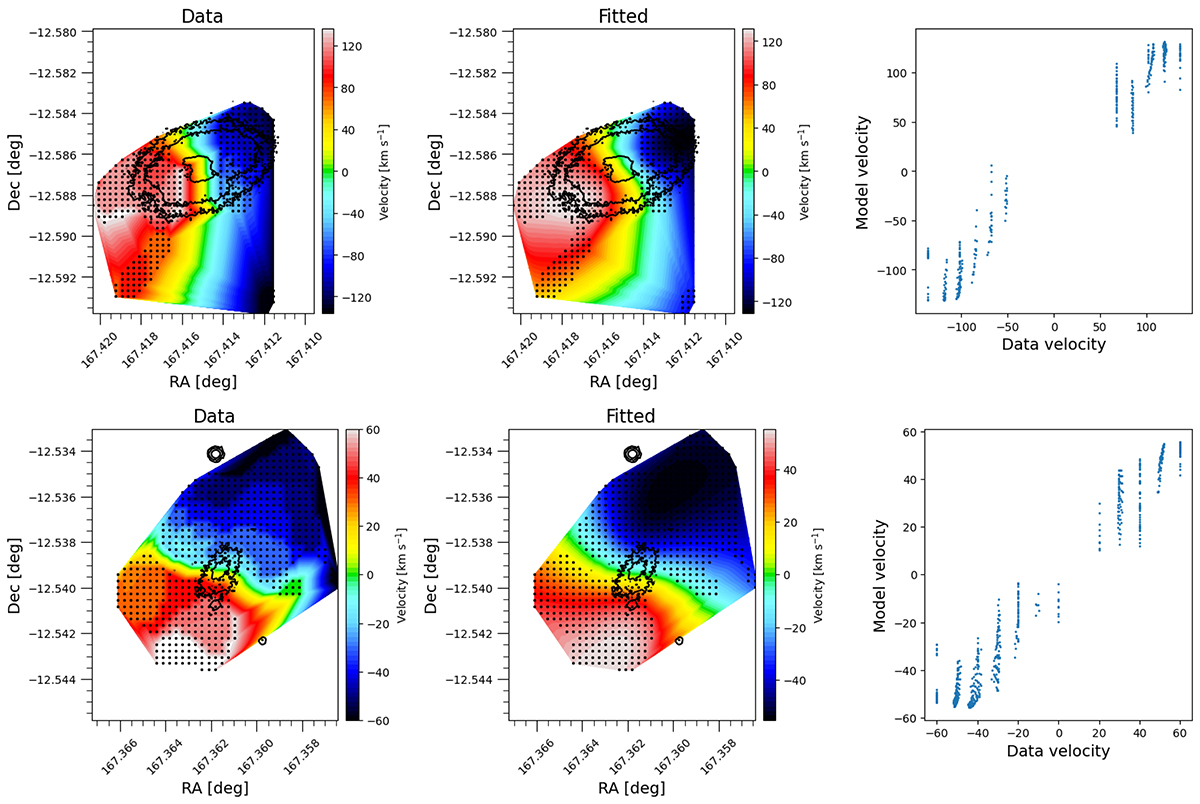
Fig. 16.
Download original image
Velocity fits to the host (top) and companion (bottom) as described in the text. Dotted values are regions of measured flux, overlaid are contours from PanSTARRS images as in Fig. 12.
Current usage metrics show cumulative count of Article Views (full-text article views including HTML views, PDF and ePub downloads, according to the available data) and Abstracts Views on Vision4Press platform.
Data correspond to usage on the plateform after 2015. The current usage metrics is available 48-96 hours after online publication and is updated daily on week days.
Initial download of the metrics may take a while.