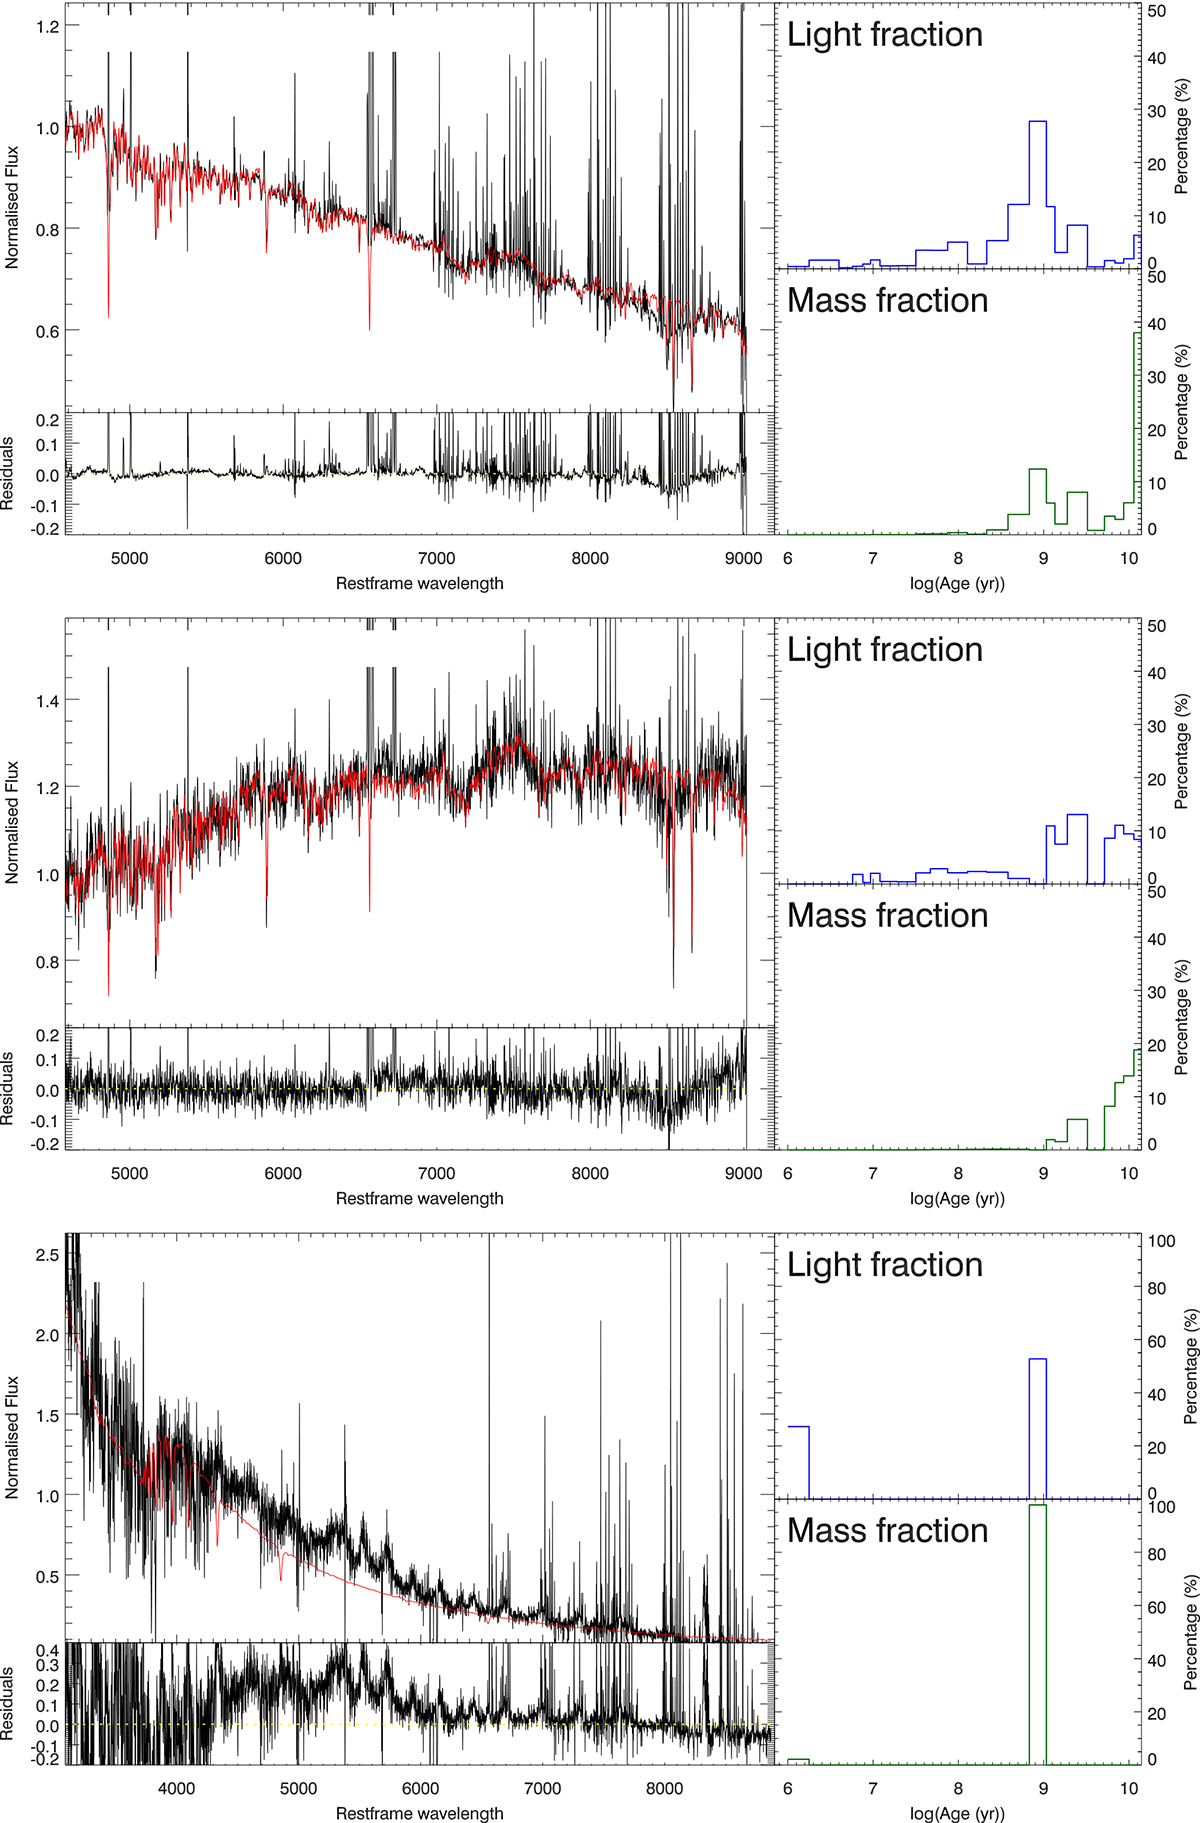
Fig. 10.
Download original image
Stellar population fits of different representative spectra. Top panel: Combined spectrum of the host. Middle panel: integrated spectrum of the core. Bottom panel: GRB site using the X-shooter observations from 14 months after the GRB instead of the SN contaminated MUSE spectra. In each panel, the top left box shows the observed spectrum (black) with the fitted spectrum overplotted in red, the lower left panel the residuals of the fit. The boxes on the right show the light (top) and mass (bottom) fraction for SPs at different ages.
Current usage metrics show cumulative count of Article Views (full-text article views including HTML views, PDF and ePub downloads, according to the available data) and Abstracts Views on Vision4Press platform.
Data correspond to usage on the plateform after 2015. The current usage metrics is available 48-96 hours after online publication and is updated daily on week days.
Initial download of the metrics may take a while.