Open Access
Fig. 6
Download original image
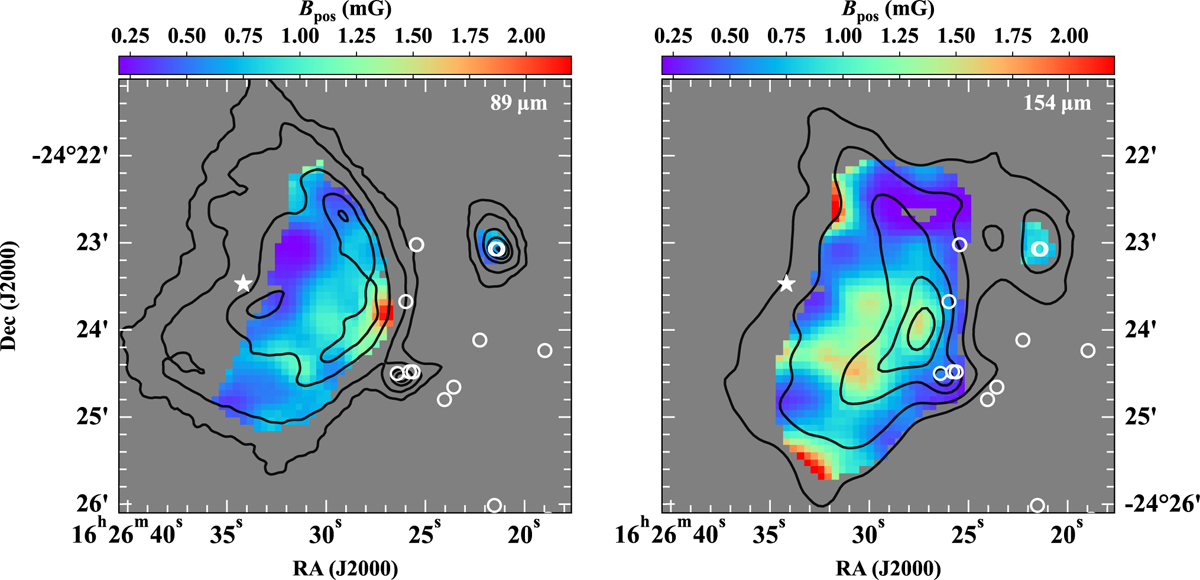
Maps of B-field strengths projected in the plane-of-the-sky (Bpos) in ρ Oph-A using data in band C (left panel) and band D (right panel), respectively. The contours in each map are similar as in Fig. 2. The star symbol marks the position of the Oph-S1 star and small circle symbols show the position of YSOs.
Current usage metrics show cumulative count of Article Views (full-text article views including HTML views, PDF and ePub downloads, according to the available data) and Abstracts Views on Vision4Press platform.
Data correspond to usage on the plateform after 2015. The current usage metrics is available 48-96 hours after online publication and is updated daily on week days.
Initial download of the metrics may take a while.