Open Access
Fig. 3
Download original image
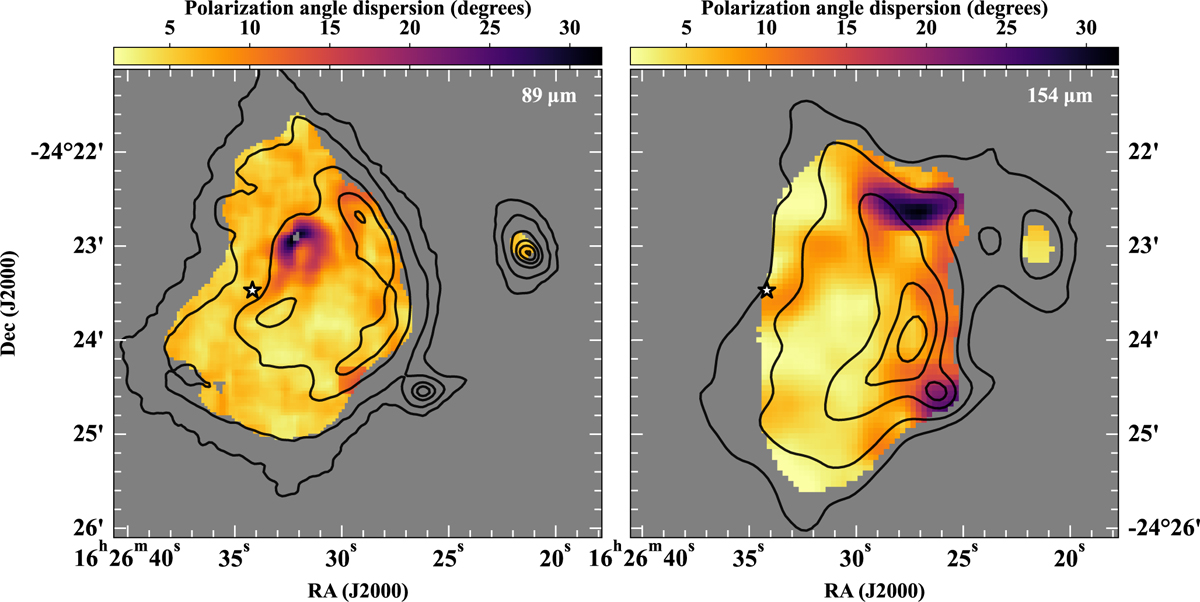
Polarization angle dispersion maps using data in band C (left panel) and band D (right panel). The black contours are from the total intensity map at the corresponding wavelength, with the contour levels at 0.12, 0.2, 0.4, 0.6, and 0.8 Jy/arcsec2. The star symbol in each map indicates the position of the Oph-S1 star.
Current usage metrics show cumulative count of Article Views (full-text article views including HTML views, PDF and ePub downloads, according to the available data) and Abstracts Views on Vision4Press platform.
Data correspond to usage on the plateform after 2015. The current usage metrics is available 48-96 hours after online publication and is updated daily on week days.
Initial download of the metrics may take a while.