Fig. 2
Download original image
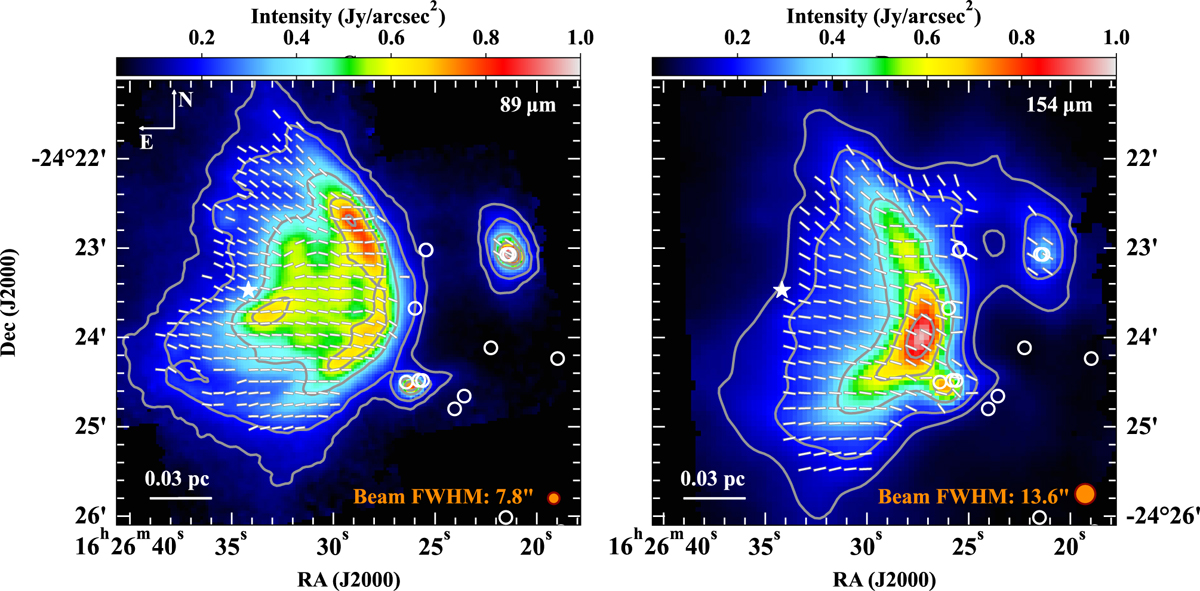
Maps of the B-field orientation (white segments) on top of the total intensity (Stokes-I, color maps) toward ρ Oph-A, observed with SOFIA/HAWC+ in band C (left) and band D (right), centered at 89 and 154 μm, respectively. The gray contours in each map show the Stokes-I intensity at the corresponding wavelength, with contour levels at 0.12, 0.2, 0.4, 0.6, and 0.8 Jy/arcsec2. The star symbol marks the position of Oph-S1 star. Small white circle symbols indicate the positions of YSOs. The filled orange circles show the beam size of each color map.
Current usage metrics show cumulative count of Article Views (full-text article views including HTML views, PDF and ePub downloads, according to the available data) and Abstracts Views on Vision4Press platform.
Data correspond to usage on the plateform after 2015. The current usage metrics is available 48-96 hours after online publication and is updated daily on week days.
Initial download of the metrics may take a while.