Open Access
Fig. B.1
Download original image
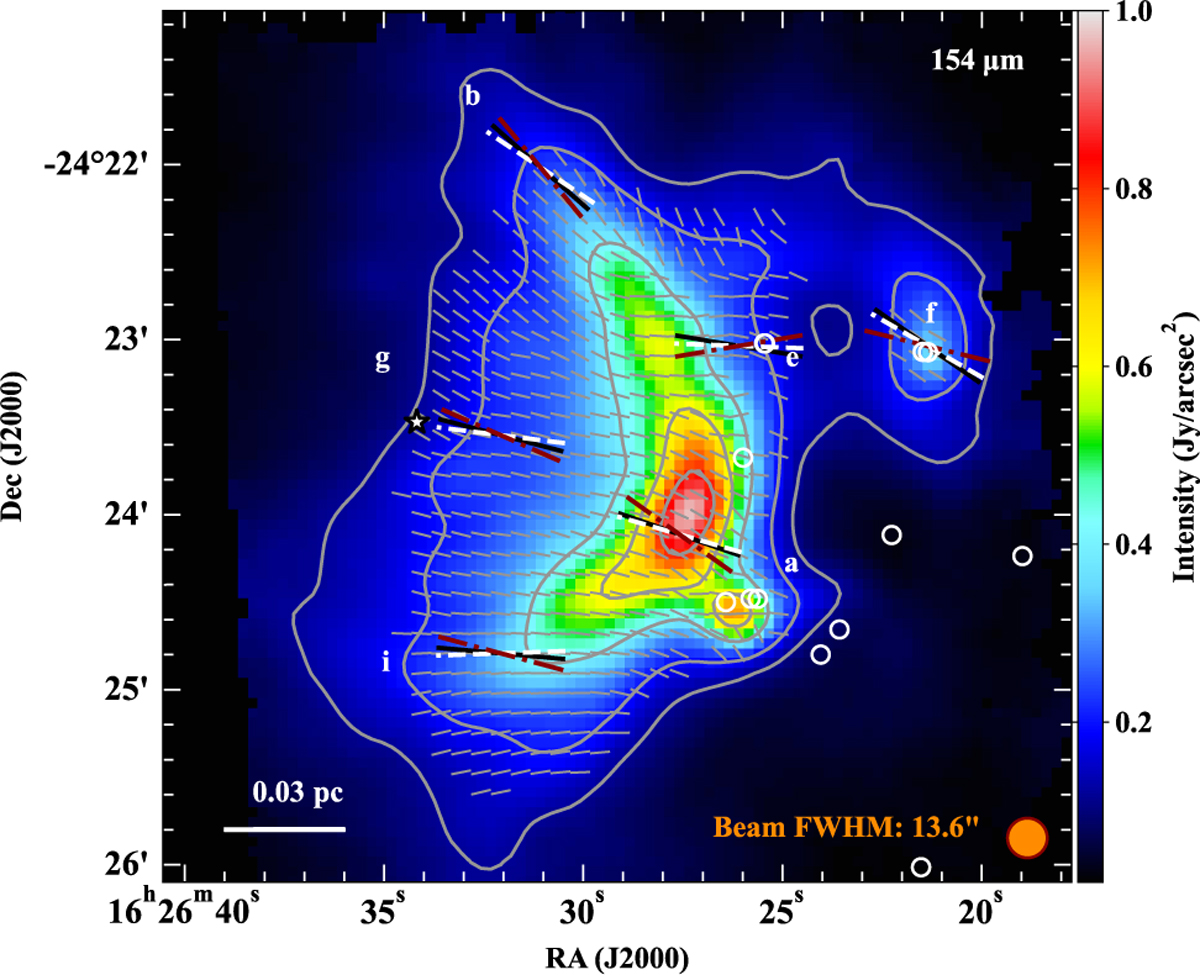
Same as the right panel in Fig. 2 but with B-field vectors from POL-2 data added (red dash-dotted vectors, Kwon et al. 2018). These vectors represent the mean B-field position angles in subregions (see texts). White and black dashed vectors show the corresponding mean B-field position angles at 89 and 154 μm.
Current usage metrics show cumulative count of Article Views (full-text article views including HTML views, PDF and ePub downloads, according to the available data) and Abstracts Views on Vision4Press platform.
Data correspond to usage on the plateform after 2015. The current usage metrics is available 48-96 hours after online publication and is updated daily on week days.
Initial download of the metrics may take a while.