Fig. A.2
Download original image
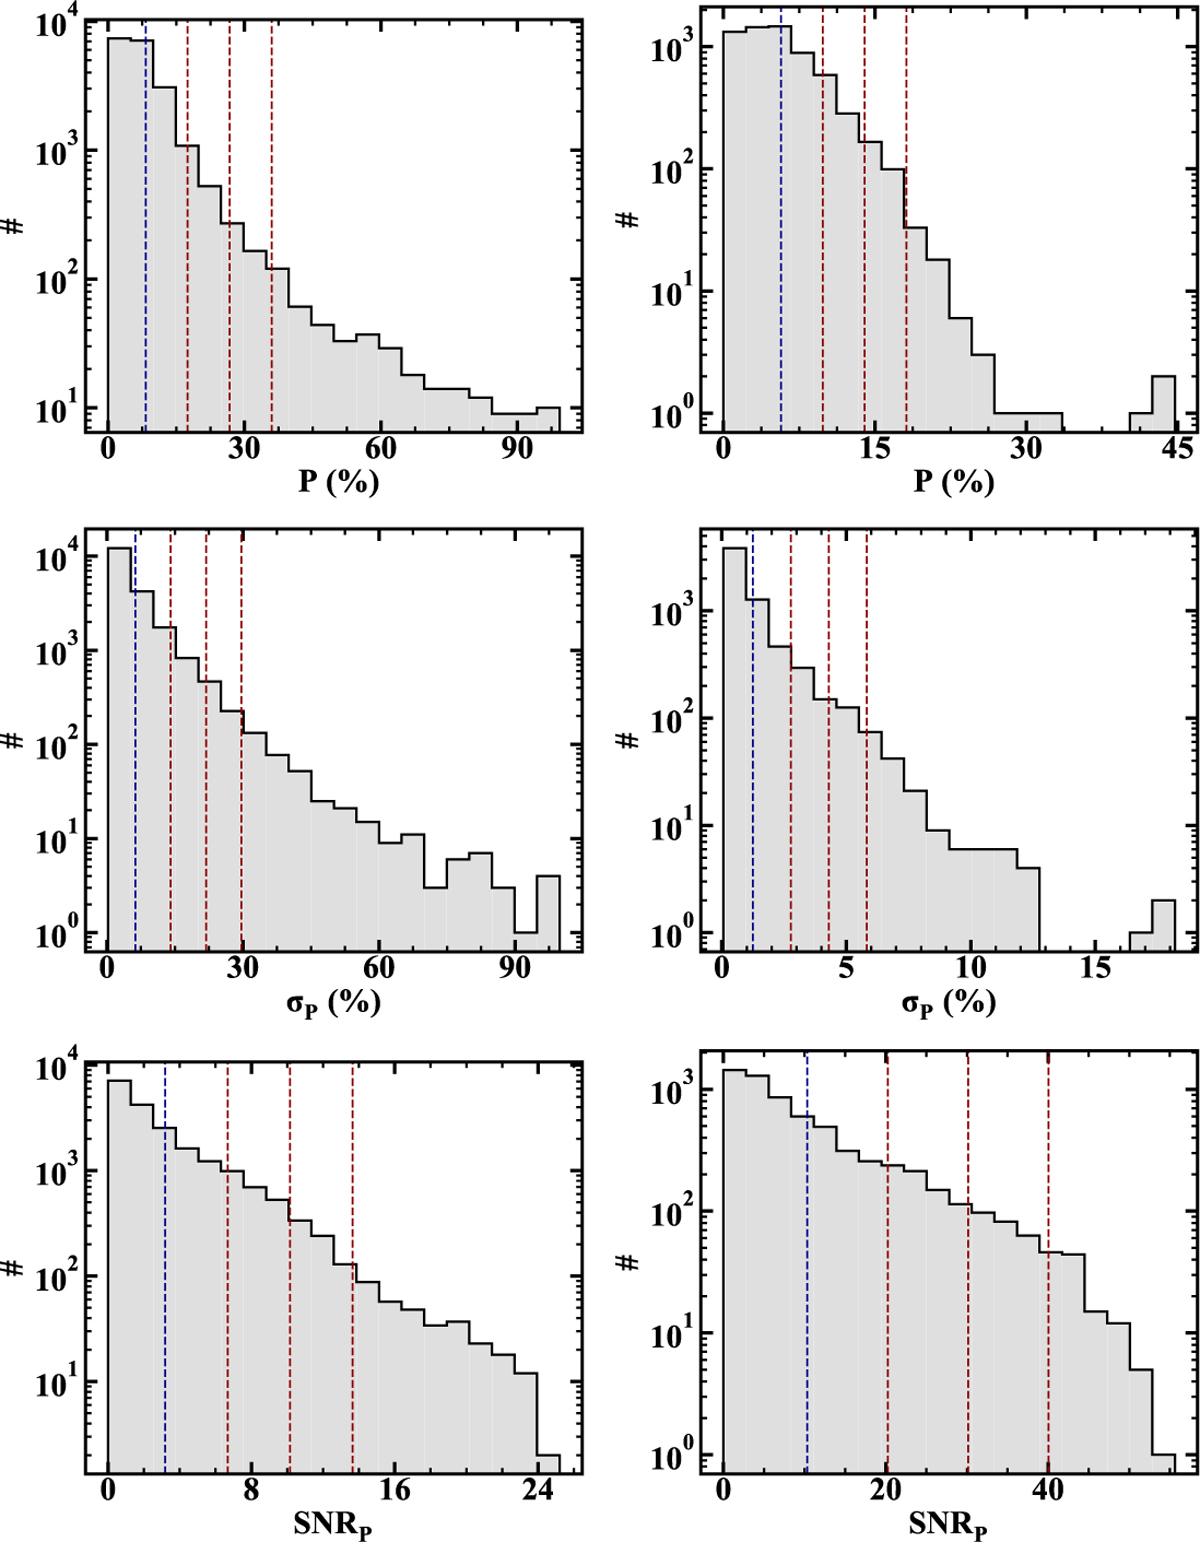
Histograms of p (top panels), σp (middle panels), and SNRp (bottoms panels) of the SOFIA/HAWC+ data. Left panels represent data in band C at 89 μm and right panels represent data in band D at 154 μm. The blue vertical dashed lines in each panel represent the mean value of the distribution. The red vertical dashed lines show the position of mean value plus 1σ, 2σ, and 3σ of the distribution from left to right, respectively.
Current usage metrics show cumulative count of Article Views (full-text article views including HTML views, PDF and ePub downloads, according to the available data) and Abstracts Views on Vision4Press platform.
Data correspond to usage on the plateform after 2015. The current usage metrics is available 48-96 hours after online publication and is updated daily on week days.
Initial download of the metrics may take a while.