Fig. 9
Download original image
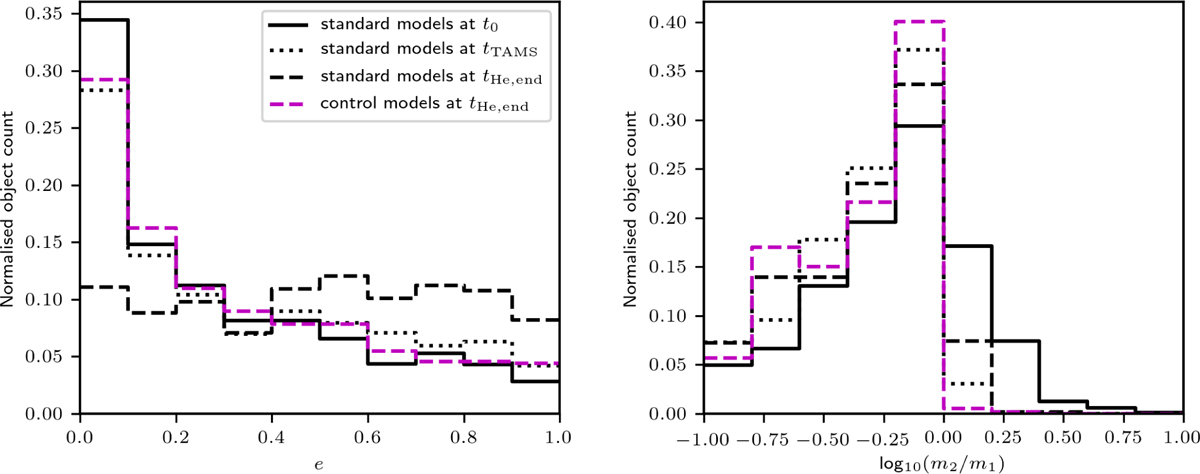
The eccentricity distribution (left panel) and mass ratio distribution (right panel) of ProCeps and Cepheids in binaries. The solid, dotted and dashed line shows the distribution at t0, tTAMS, and tHe,end, respectively. The plot is for Cepheids formed in a population of star clusters with Rg = 8 kpc, Z = 0.014, and of the adopted ECMF of slope β = 2 Eq. (4).
Current usage metrics show cumulative count of Article Views (full-text article views including HTML views, PDF and ePub downloads, according to the available data) and Abstracts Views on Vision4Press platform.
Data correspond to usage on the plateform after 2015. The current usage metrics is available 48-96 hours after online publication and is updated daily on week days.
Initial download of the metrics may take a while.