Fig. 8
Download original image
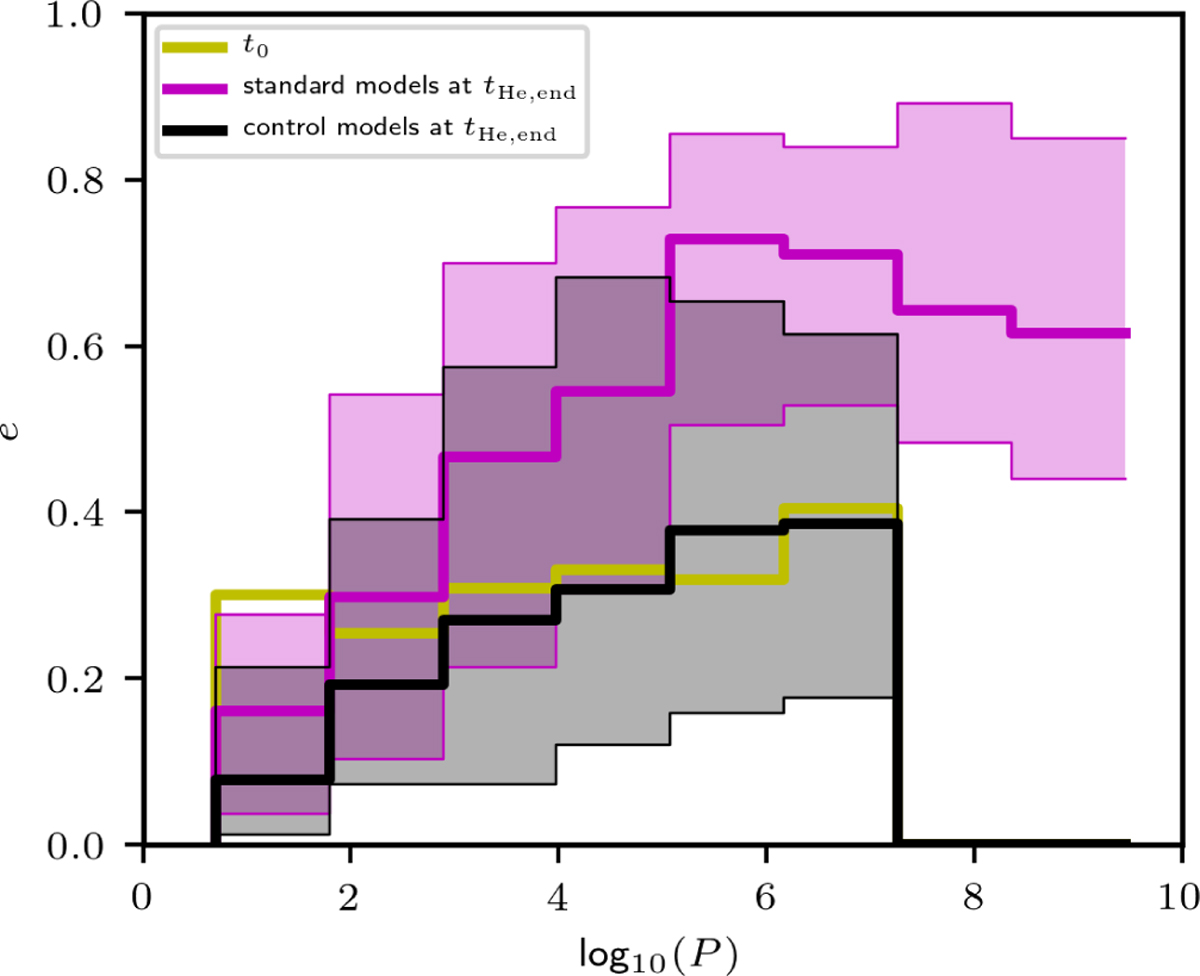
Eccentricity as a function of period for BiCeps in standard models (magenta) and control models (black). The thick lines show the mean eccentricity for given period, and the coloured areas represent the interquartile range. The figure quantitatively shows the boost of eccentricity for Cepheids which are subjected to cluster dynamics. The mean eccentricity at time t0 (identical for both models) is shown by the yellow line.
Current usage metrics show cumulative count of Article Views (full-text article views including HTML views, PDF and ePub downloads, according to the available data) and Abstracts Views on Vision4Press platform.
Data correspond to usage on the plateform after 2015. The current usage metrics is available 48-96 hours after online publication and is updated daily on week days.
Initial download of the metrics may take a while.