Fig. 7
Download original image
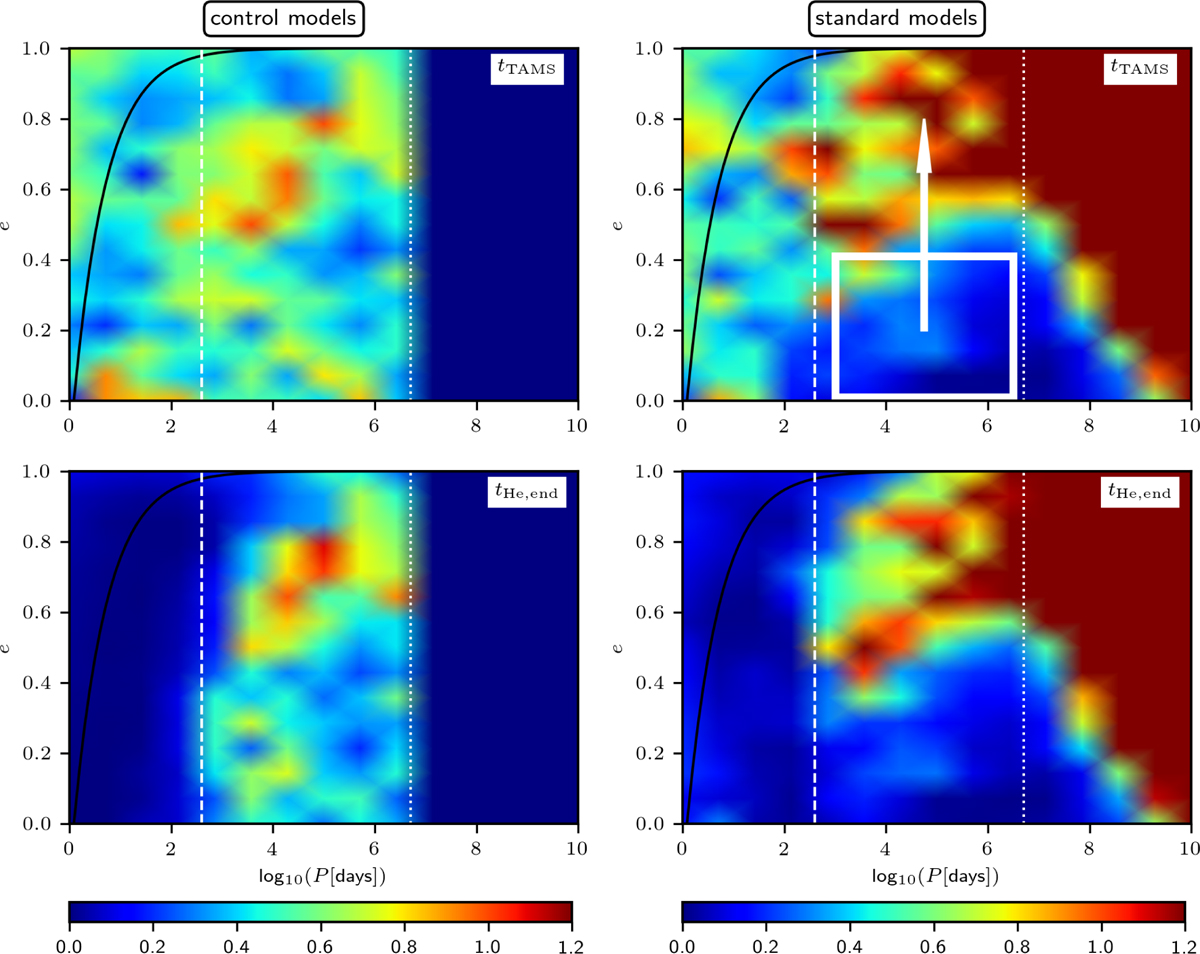
Change in orbital period and eccentricity between t0 and tTAMS (upper row), and between t0 and the end of the core helium burning tHe,end (lower row). The colour-scale shows the ratio between the number of ProCeps (at tTAMS) or Cepheids (at tHe,end) and the number of ProCeps at t0, which are located at the nearby position in the log10(P) − e plane. Values larger (lower) than 1 indicate that the number of ProCeps or Cepheids increased (decreased) since t0. The dashed and dotted white lines show the period threshold for coalescence (at log10(P[days]) = 2.6) and the upper limit on the birth period distribution (log10(P[days]) = 6.7), respectively. The black line shows the maximum allowed eccentricity for given orbital period at t0 (assuming m1 + m2 = 9 M⊙ and stellar radius of R1 = 5 R⊙). The absence of binaries with log10(P[days]) ≲ 2.6 at tHe.end is due to stellar collisions. The depletion of binaries with log10(P[days]) ≳ 3 and e ≲ 0.5 (the white rectangle with an indication of eccentricity evolution) seen already at the tTAMS in the standard model is due to dynamical encounters with other cluster members (the depletion is absent in the control model). The binaries with log10(P[days]) ≳ 6.7 in the standard model (and absent in the control model) are mostly outer orbits in triples.
Current usage metrics show cumulative count of Article Views (full-text article views including HTML views, PDF and ePub downloads, according to the available data) and Abstracts Views on Vision4Press platform.
Data correspond to usage on the plateform after 2015. The current usage metrics is available 48-96 hours after online publication and is updated daily on week days.
Initial download of the metrics may take a while.