Fig. 6

Download original image
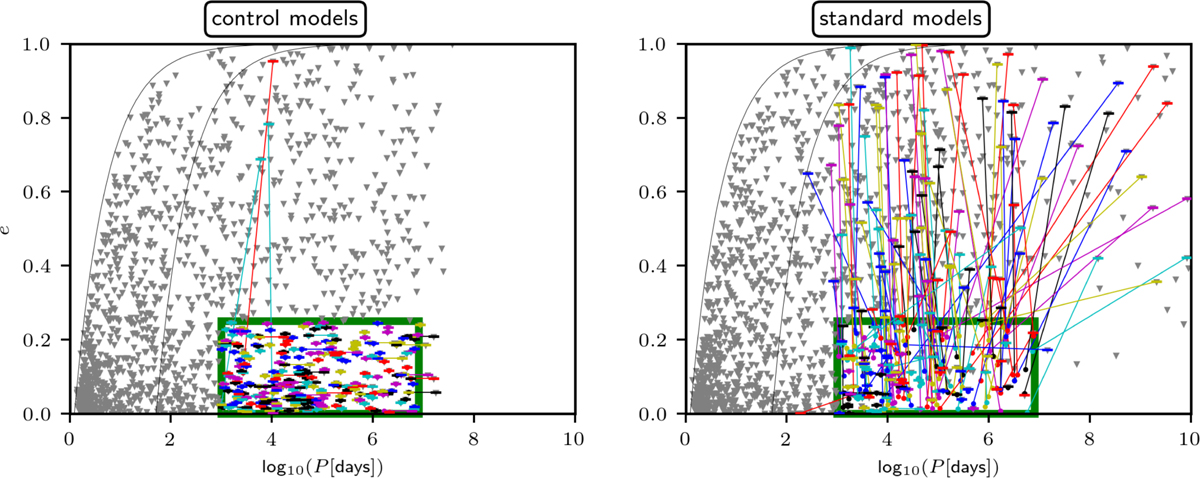
Evolution of the orbital period and eccentricity between the ZAMS (grey triangles) and TAMS (coloured bars) for the binaries which contain at least one ProCep. Although the plot shows all the binaries at the ZAMS, it shows the state at the TAMS only of the binaries which originate with (log10(P), e) from the interval (3, 7) × (0, 0.25) (the green rectangle). The lines connect the states at the ZAMS with those at the TAMS. The purpose of the dot and line colour is only to aid clarity. The black lines indicate the maximum allowed eccentricity of a binary of given orbital period to avoid a physical collision with its companion for m1 + m2 = 9 M⊙ and stellar radii of R1 = 5 R⊙ (on the MS) and R1 = 60 R⊙ (before the second passage through the instability strip). Left panel: control models. Only the minority of binaries evolve; these are the secondaries where the primary mass loss results in an increase of the orbital period. Right panel: models with cluster environment, which result in a pronounced increase of eccentricity. Both cases are calculated for Z = 0.014, Rg = 8 kpc and for the cluster mass range from Mecl = 50 to Mecl = 6400 M⊙. Note: the binaries which either form or are destroyed between the ZAMS and TAMS are not shown.
Current usage metrics show cumulative count of Article Views (full-text article views including HTML views, PDF and ePub downloads, according to the available data) and Abstracts Views on Vision4Press platform.
Data correspond to usage on the plateform after 2015. The current usage metrics is available 48-96 hours after online publication and is updated daily on week days.
Initial download of the metrics may take a while.


