Fig. 3
Download original image
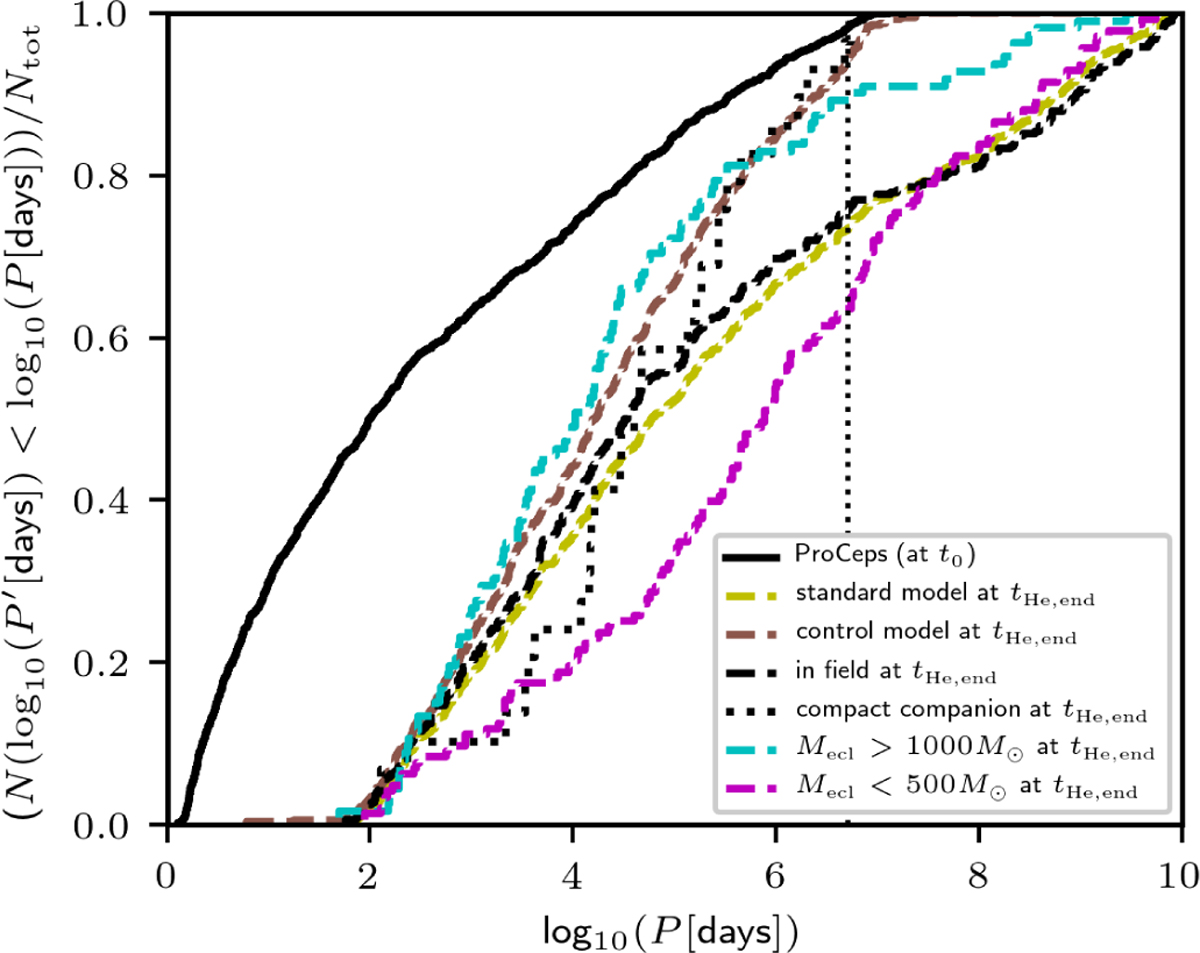
Cumulative distribution of orbital periods of ProCeps (taken at t0; black solid line) and BiCeps (taken at tHe,end; dashed lines). The orbital period distribution of BiCeps is shown separately for Cepheids in the lower (magenta dashed line) and more massive clusters (cyan dashed line), in the whole cluster population (yellow dashed line), in the field originating from the whole cluster population (black dashed line), and in the control model (brown dashed line). The orbital period distribution of Cepheids with a compact companion is indicated by the black dotted line. The distributions are normalised to the total number of BiCeps in each group. There are almost no BiCeps with log10(P[days]) ≲ 2 because of coalescence with their companion before the onset of core helium burning. The vertical dotted line represents the upper limit on the initial orbital periods (log10(P[days]) ≲ 6.7). All BiCeps with an orbital period longer than that formed due to dynamical encounters in clusters.
Current usage metrics show cumulative count of Article Views (full-text article views including HTML views, PDF and ePub downloads, according to the available data) and Abstracts Views on Vision4Press platform.
Data correspond to usage on the plateform after 2015. The current usage metrics is available 48-96 hours after online publication and is updated daily on week days.
Initial download of the metrics may take a while.