Fig. 14
Download original image
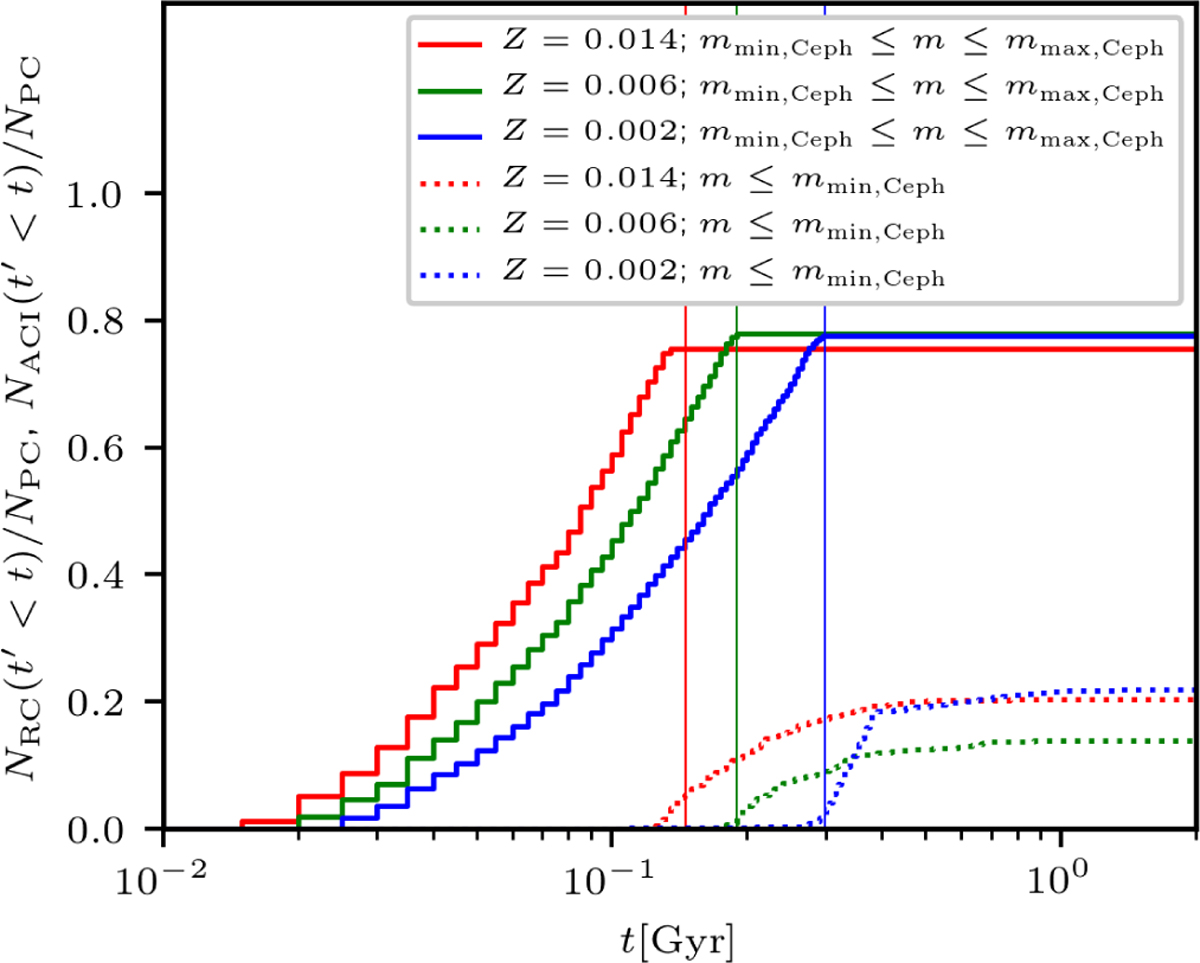
Cumulative number of stars which have become Cepheids by the time, t, for the control simulations normalized to the number of ProCeps which is taken at the beginning. Cepheids originating from ProCeps (solid lines) are plotted separately from the ones originating from stars of m < mmin,Ceph (dotted lines). The metallicity of the models is indicated by colour. The thin vertical solid lines show the time tHe,end, namely, the time of the least massive non-interacting Cepheid which can occur at a given metallicity; all the Cepheids occurring later than tHe,end gained some of their mass in interaction with their companion.
Current usage metrics show cumulative count of Article Views (full-text article views including HTML views, PDF and ePub downloads, according to the available data) and Abstracts Views on Vision4Press platform.
Data correspond to usage on the plateform after 2015. The current usage metrics is available 48-96 hours after online publication and is updated daily on week days.
Initial download of the metrics may take a while.