Fig. 12
Download original image
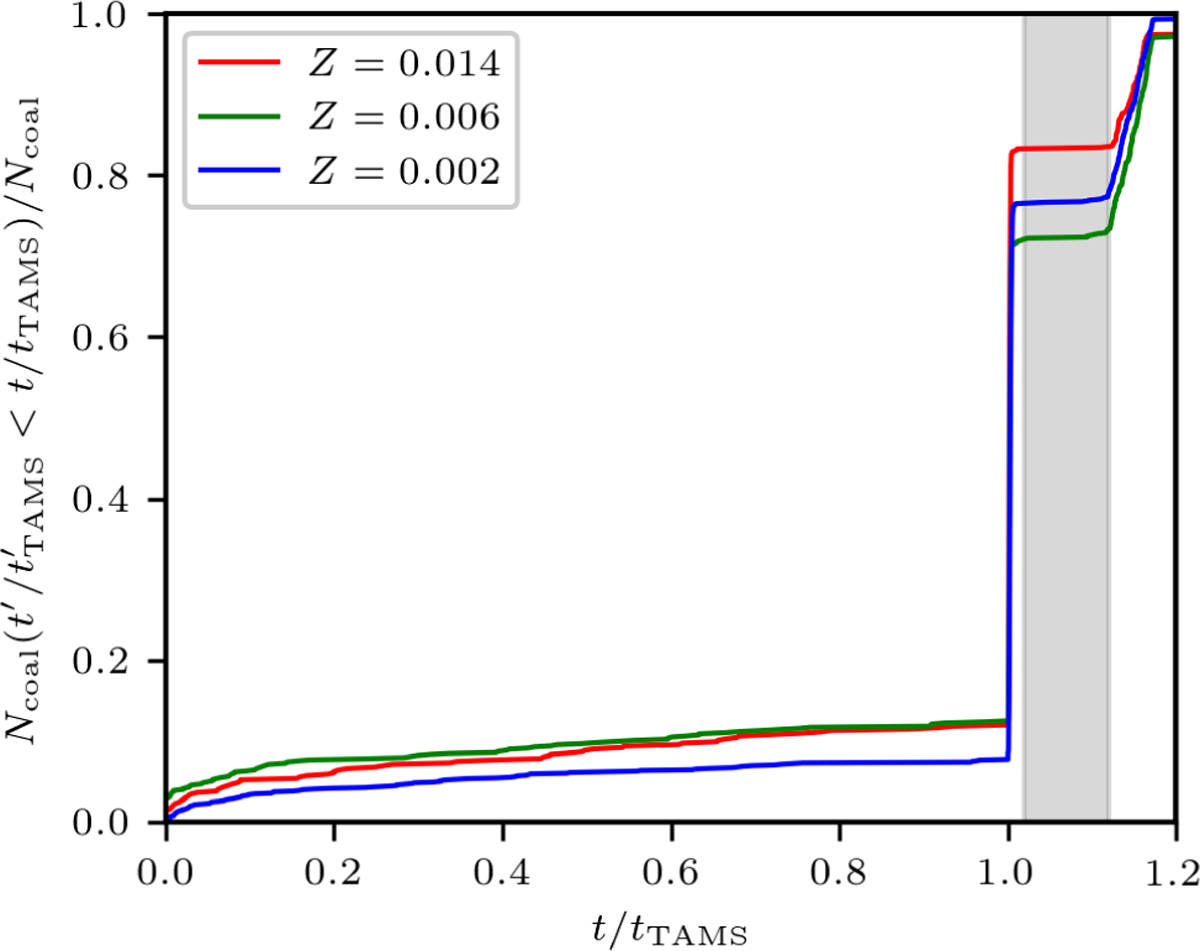
Cumulative distribution of the time of coalescence for the Ran-Ceps that experienced a coalescence normalised to the ttams of each individual Cepheid. Results for clusters with Rg = 8 kpc are plotted separately for the metallicity Z = 0.014 (red line), Z = 0.006 (green) and Z = 0.002 (blue). The approximate time when the stars are located within the Cepheid instability strip is indicated by the grey area.
Current usage metrics show cumulative count of Article Views (full-text article views including HTML views, PDF and ePub downloads, according to the available data) and Abstracts Views on Vision4Press platform.
Data correspond to usage on the plateform after 2015. The current usage metrics is available 48-96 hours after online publication and is updated daily on week days.
Initial download of the metrics may take a while.