Fig. 1
Download original image
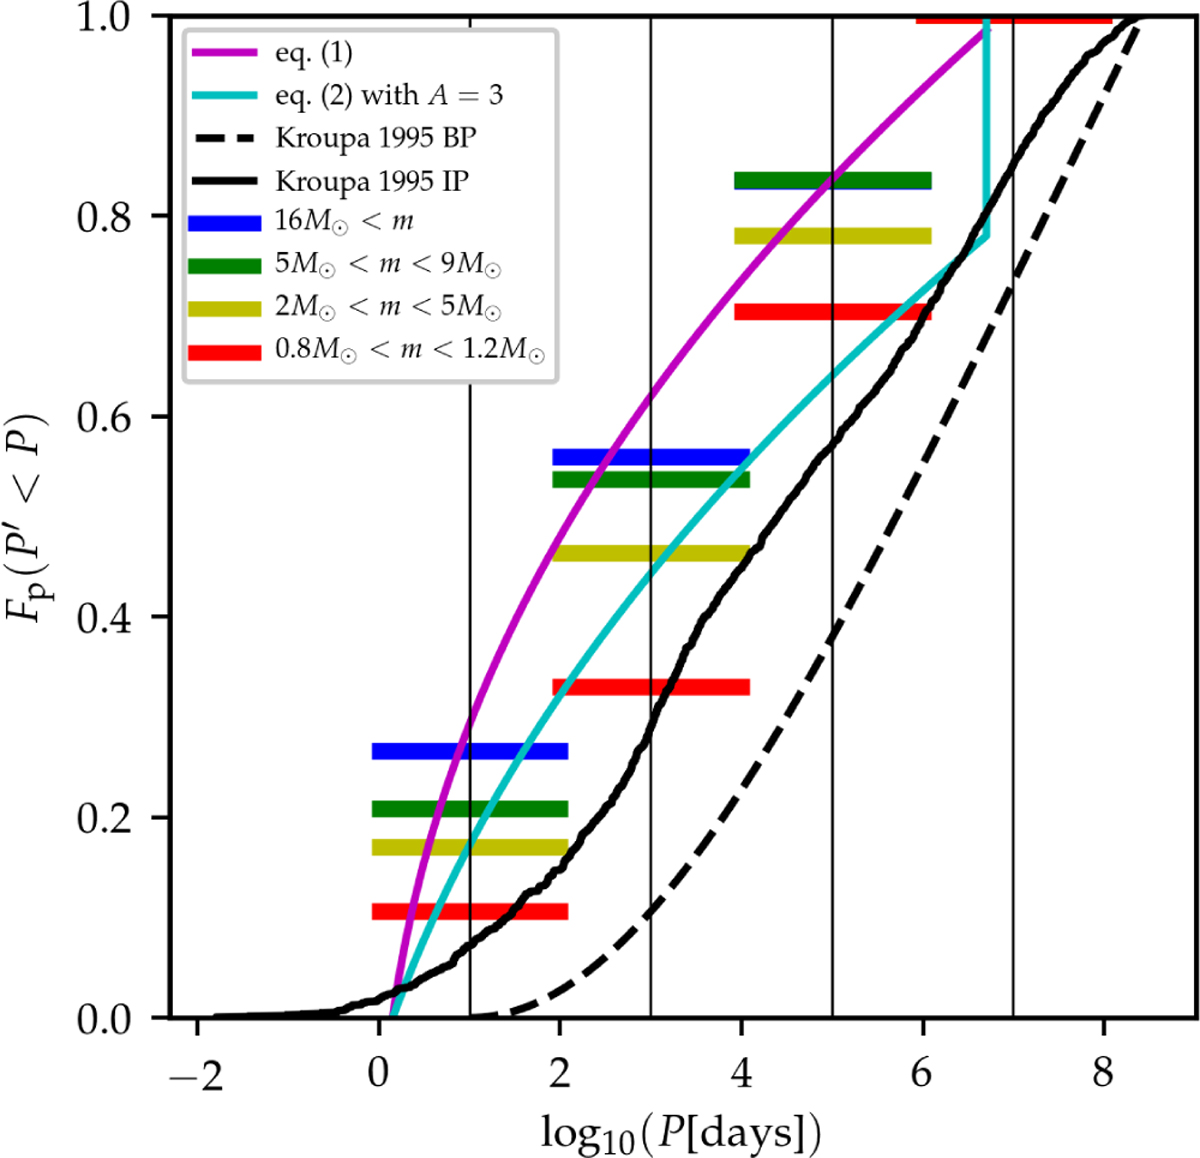
Cumulative distribution functions of orbital periods of binary stars according to the primary mass. The observed distributions for primaries in specific mass intervals are shown by bars (Moe & Di Stefano 2017): O-type stars (m > 16 M⊙; blue bars), mid B-type stars (5 M⊙ < m < 9 M⊙; green), late B- and A-type stars (2 M⊙ < m < 5 M⊙; yellow), and solar type stars (0.8 M⊙ < m < 1.2 M⊙; red). The theoretical birth distribution of Kroupa (1995a) for late type stars (m < 3 M⊙; dashed black line) is transformed by pre-MS eigenevolution to the initial distribution (solid black line). The initial distribution for O-stars according to Eq. (1) (Sana et al. 2012) and the wider distribution of Eq. (2) with A = 3, which is the widest estimate on the Cepheid orbital periods, is plotted by the magenta and cyan line, respectively.
Current usage metrics show cumulative count of Article Views (full-text article views including HTML views, PDF and ePub downloads, according to the available data) and Abstracts Views on Vision4Press platform.
Data correspond to usage on the plateform after 2015. The current usage metrics is available 48-96 hours after online publication and is updated daily on week days.
Initial download of the metrics may take a while.