Fig. 6
Download original image
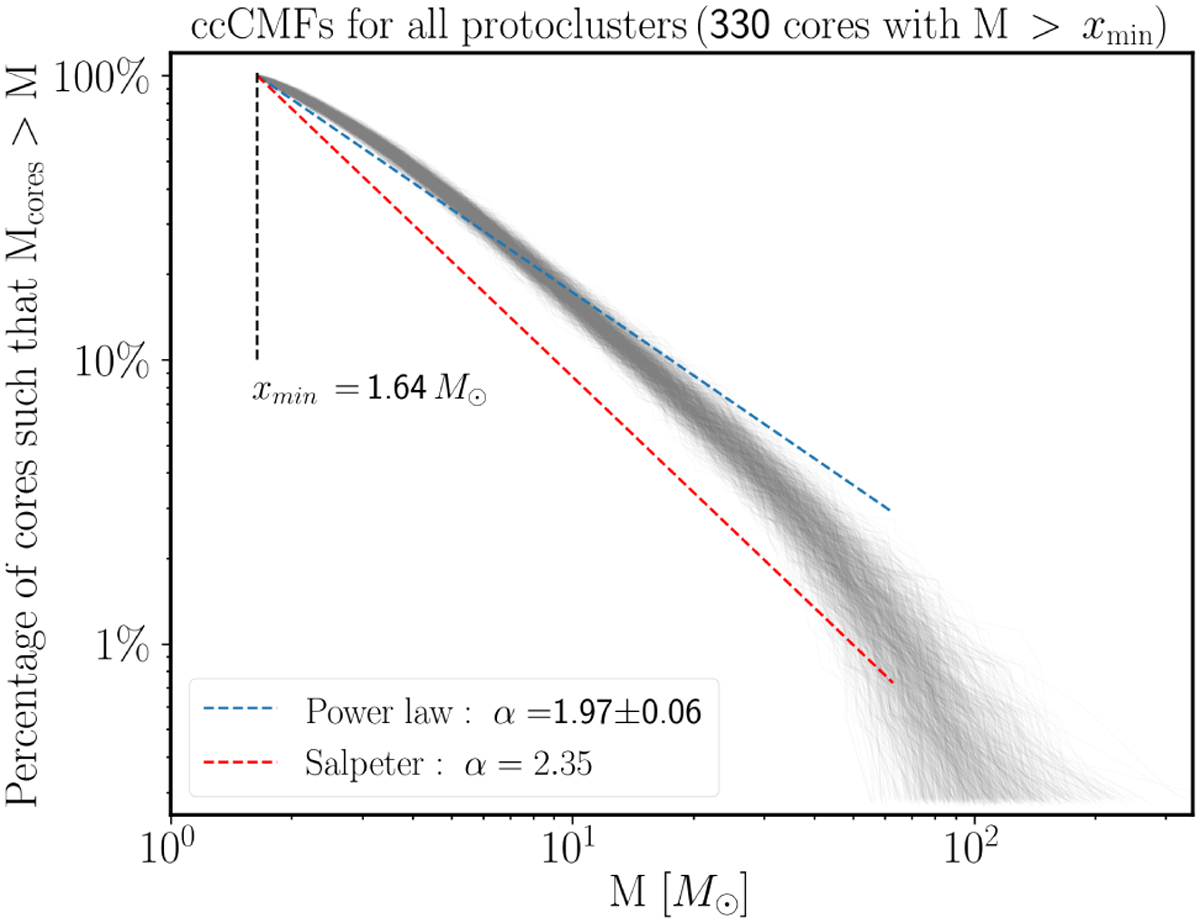
The grey curves show the complementary cumulative CMFs of the 103 core samples obtained by including flux measurement uncertainties, varying core temperatures, and applying opacity index variations on a per-regions basis (see Sect. 5.2.2), overlaid with the average fit by a power law (in blue) and the best fit with a power-law index 2.35 (in red).
Current usage metrics show cumulative count of Article Views (full-text article views including HTML views, PDF and ePub downloads, according to the available data) and Abstracts Views on Vision4Press platform.
Data correspond to usage on the plateform after 2015. The current usage metrics is available 48-96 hours after online publication and is updated daily on week days.
Initial download of the metrics may take a while.