Fig. 4
Download original image
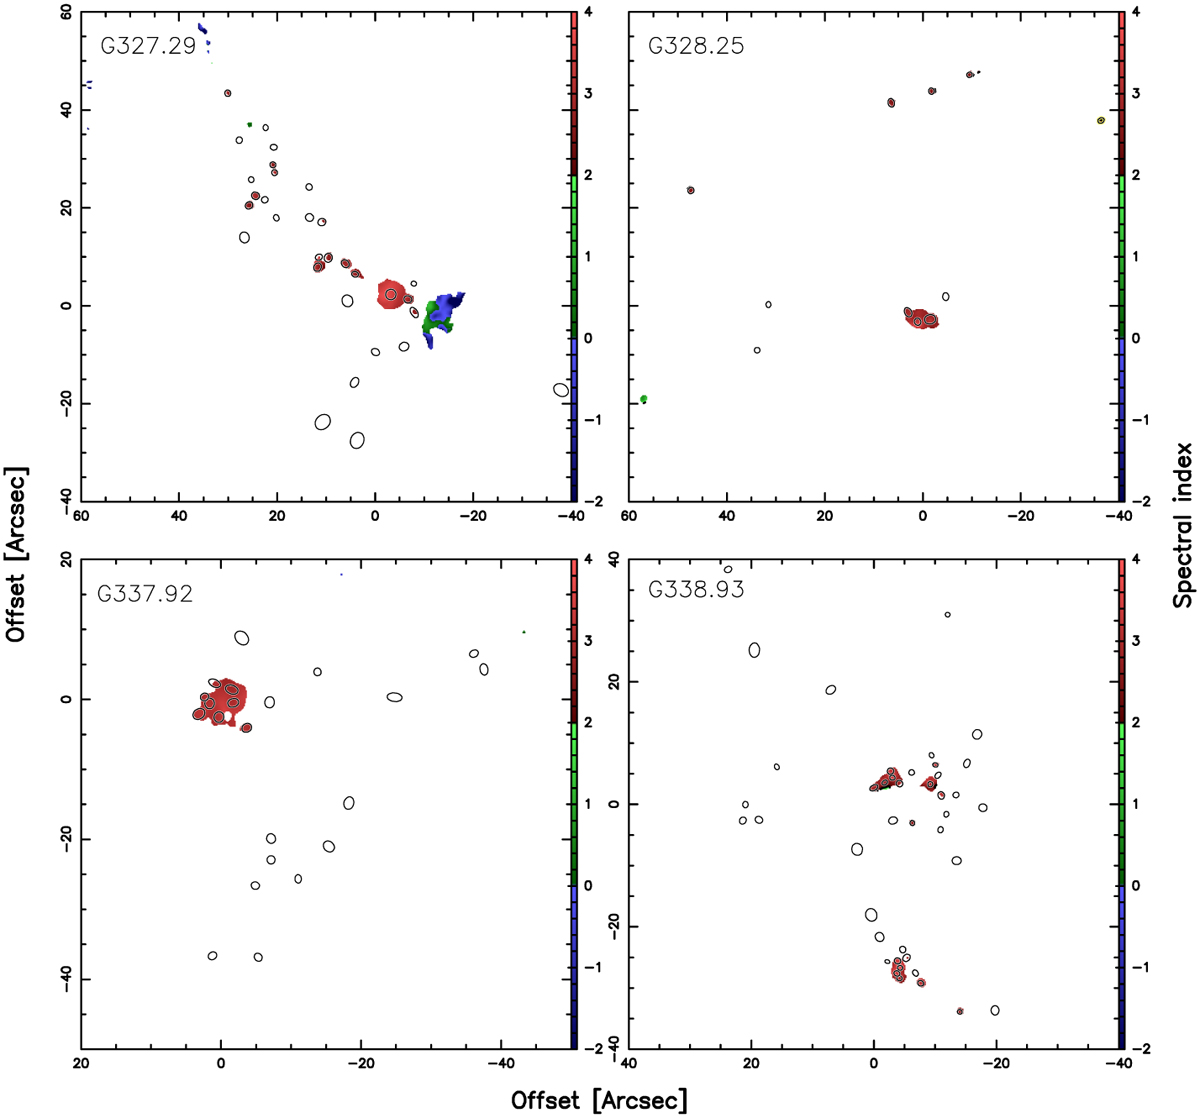
Maps of the spectral index in the 15 ALMA-IMF fields. We chose the colours such that red traces dust thermal emission, blue traces free-free emission, and green likely traces a mixture of dust and free-free emissions. The maps display the spectral index value only where the 3 mm intensity exceeds 3 σ. The black ellipses display the sources extracted by getsf. We show the remaining fields in Fig. B.1.
Current usage metrics show cumulative count of Article Views (full-text article views including HTML views, PDF and ePub downloads, according to the available data) and Abstracts Views on Vision4Press platform.
Data correspond to usage on the plateform after 2015. The current usage metrics is available 48-96 hours after online publication and is updated daily on week days.
Initial download of the metrics may take a while.