Fig. 3
Download original image
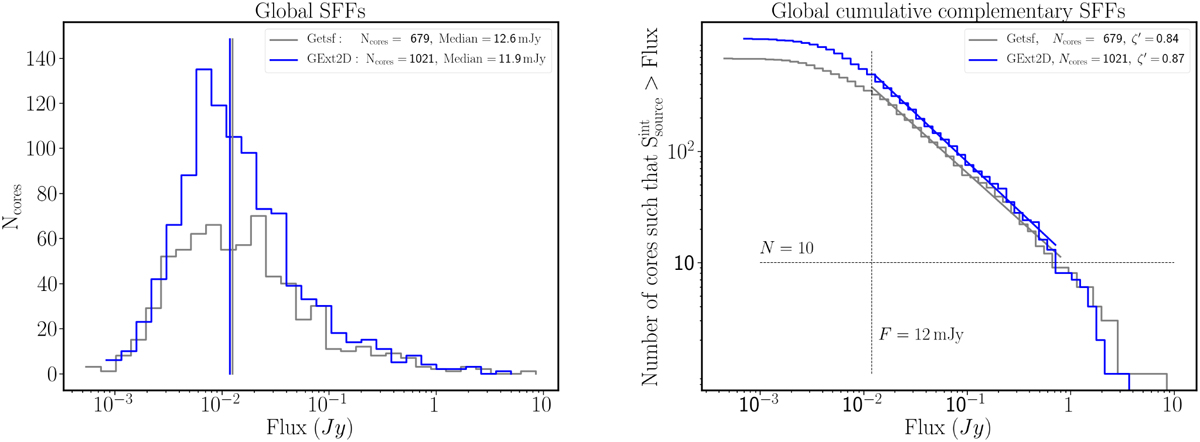
Source flux distributions for the getsf and GExt2D source extractions. The left panel displays the SFFs of the sources extracted by getsf in grey and by GExt2D in blue. The vertical blue and grey lines indicate the median values for each source catalogues, which differ by ≃5%. The right panel displays the complementary cumulative SFFs from the getsf source extraction (in grey) and from the GExt2D source extraction (in blue). The grey and blue lines display the best fits from linear regressions on the complementary cumulative SFFs from the median value at 12 mJy up to the flux at which the number of cores is smaller than 10. The corresponding ζ power-law indexes are indicated in the top right corner.
Current usage metrics show cumulative count of Article Views (full-text article views including HTML views, PDF and ePub downloads, according to the available data) and Abstracts Views on Vision4Press platform.
Data correspond to usage on the plateform after 2015. The current usage metrics is available 48-96 hours after online publication and is updated daily on week days.
Initial download of the metrics may take a while.