Fig. 1
Download original image
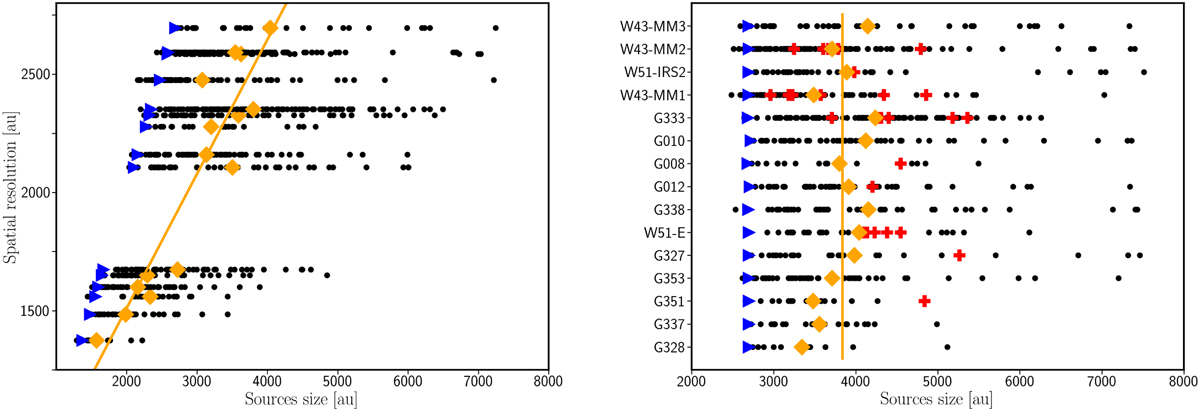
Scatter plots of the source size (black dots) extracted with getsf before (left) and after (right) the maps were smoothed to a homogeneous spatial resolution of 2700 au. The blue triangles display the beam sizes. The orange diamonds display the mean sizes of sources. In the left panel, the y-axis is the linear scale (beam × distance) of the maps in Band 6, and the orange line shows the fit to the mean source size distribution for each field. In the right panel, the orange line shows the mean core size of all 15 protoclusters, and the red crosses illustrate the cores exceeding 25 M⊙.
Current usage metrics show cumulative count of Article Views (full-text article views including HTML views, PDF and ePub downloads, according to the available data) and Abstracts Views on Vision4Press platform.
Data correspond to usage on the plateform after 2015. The current usage metrics is available 48-96 hours after online publication and is updated daily on week days.
Initial download of the metrics may take a while.