Open Access
Fig. 7
Download original image
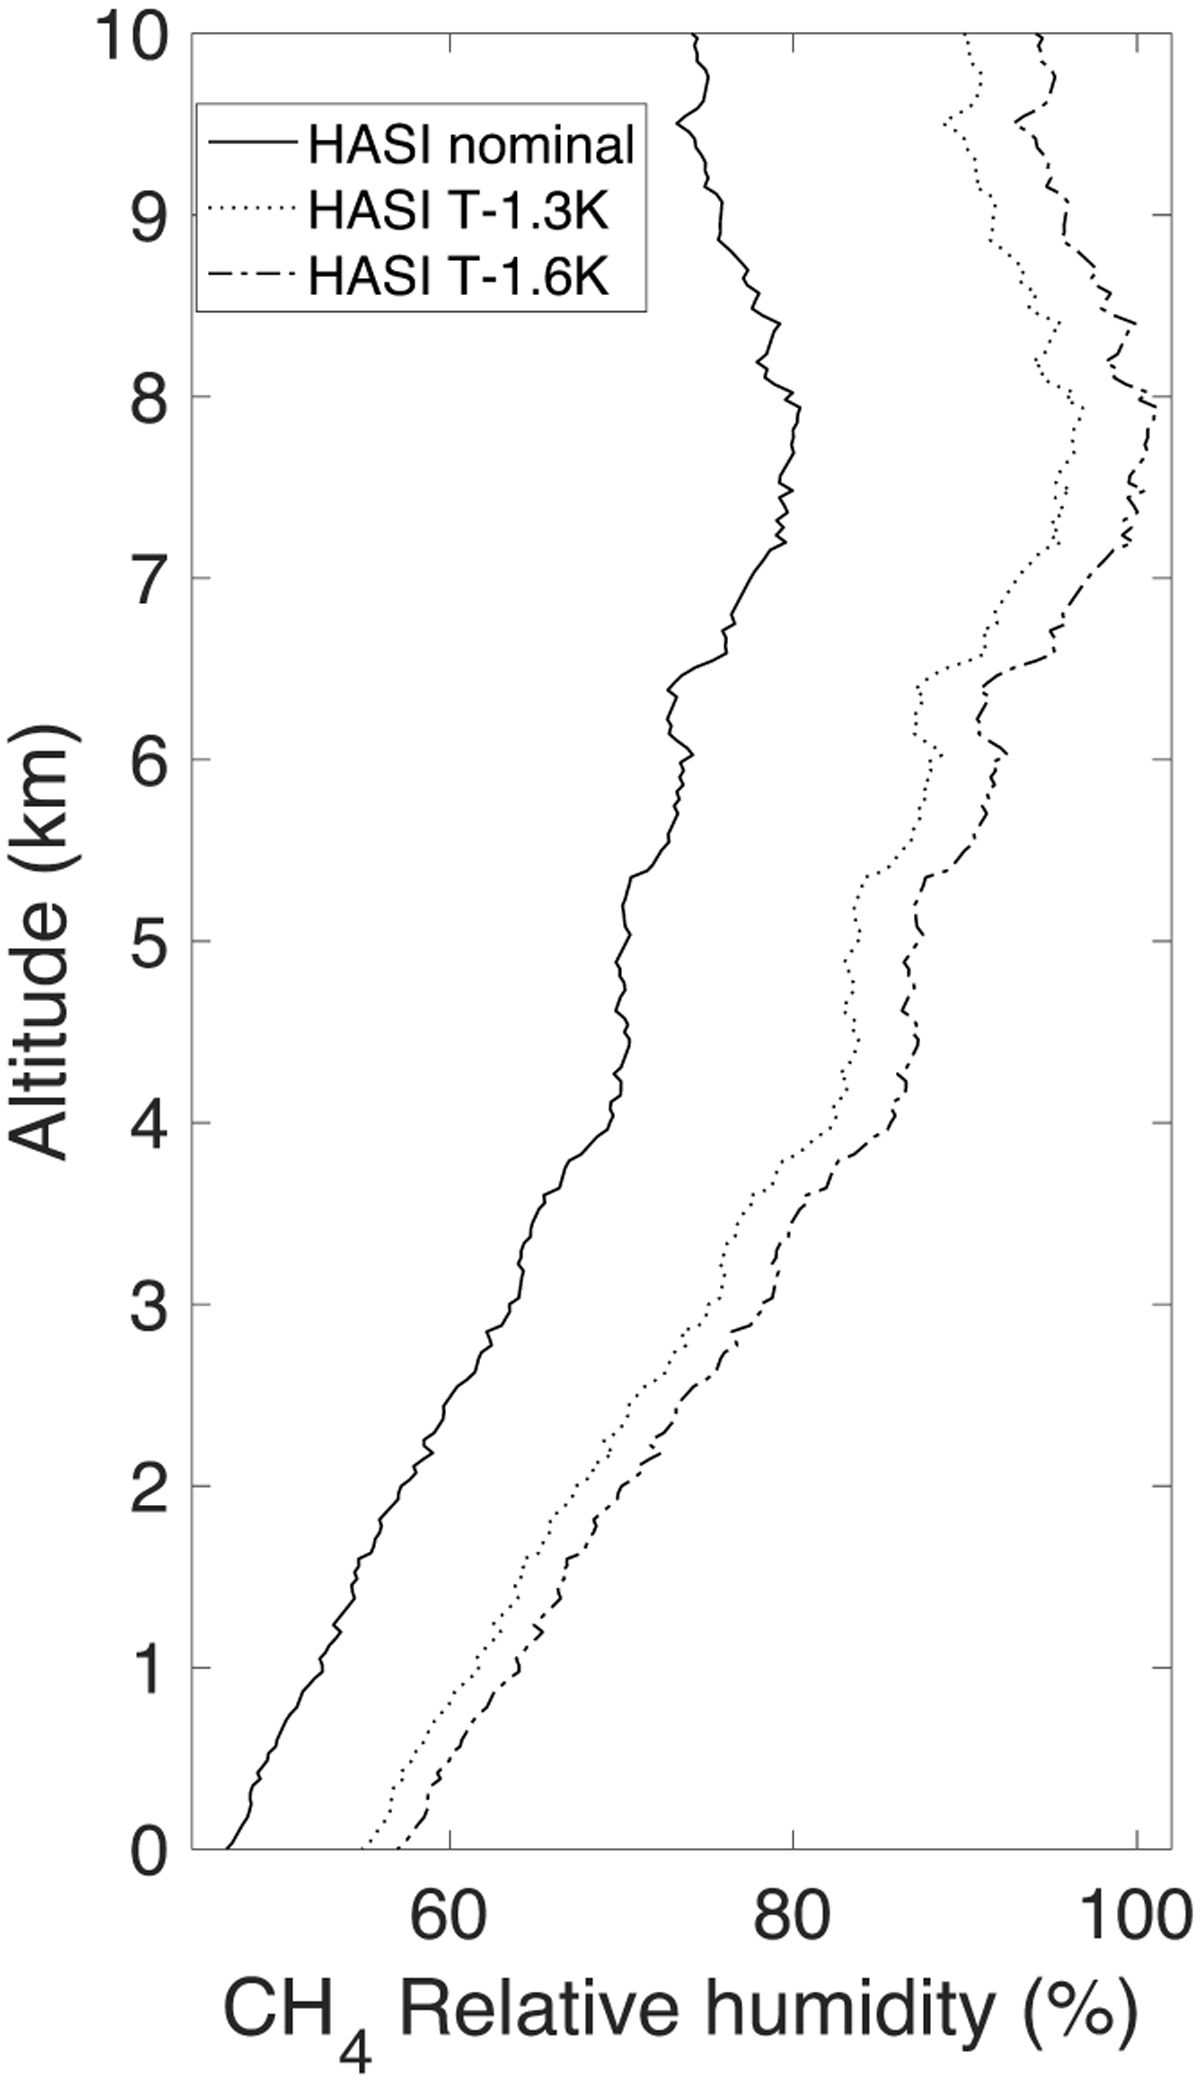
Methane relative humidity below 10 km. The three humidity profiles are calculated using the nominal HASI temperature (plain line), the HASI temperature shifted by −1.3 K (dotted line), and the HASI temperature shifted by −1.6 K (dashed line), respectively.
Current usage metrics show cumulative count of Article Views (full-text article views including HTML views, PDF and ePub downloads, according to the available data) and Abstracts Views on Vision4Press platform.
Data correspond to usage on the plateform after 2015. The current usage metrics is available 48-96 hours after online publication and is updated daily on week days.
Initial download of the metrics may take a while.