Open Access
Fig. 2
Download original image
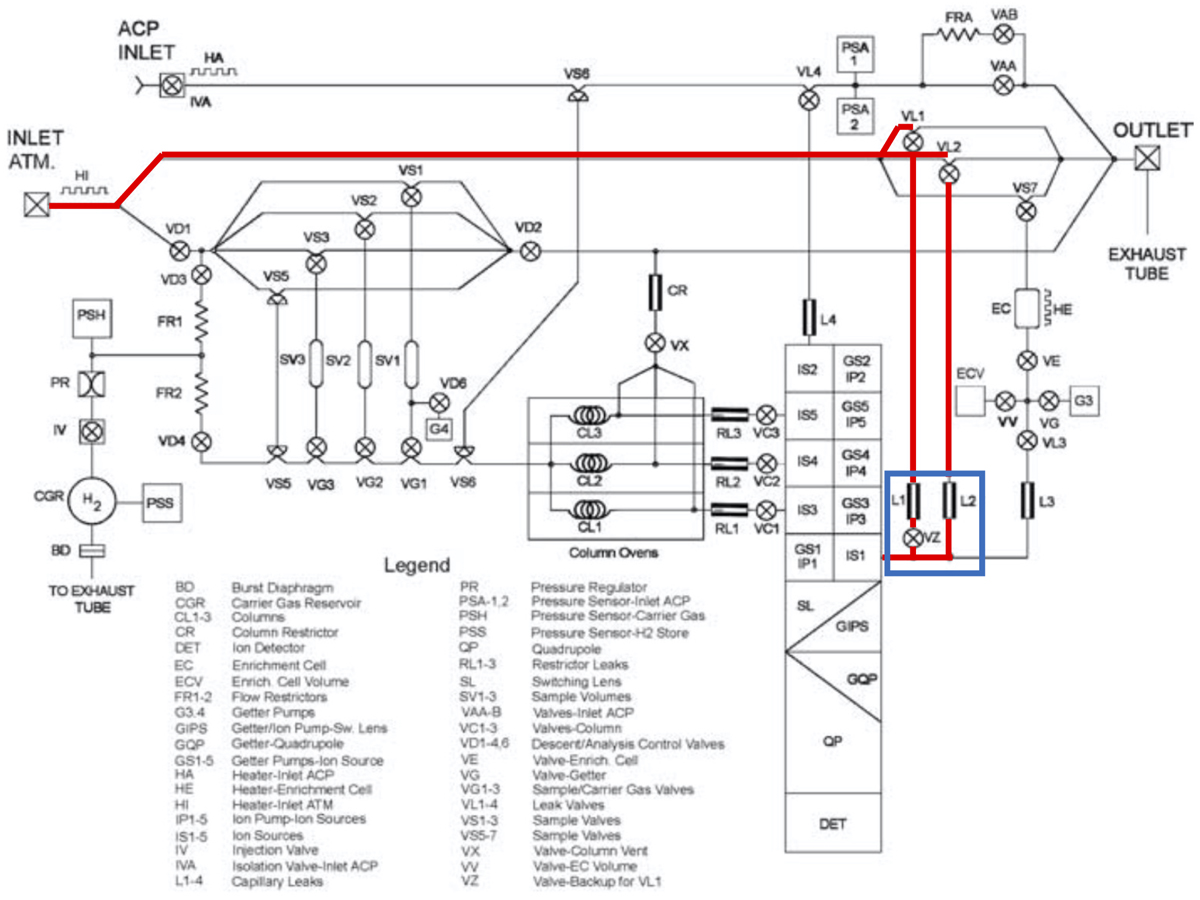
Schematic representation of gas flow in the GCMS instrument. Flow path for measurements discussed in this paper are highlighted in red. Highlighted in the blue box are the L1 and L2 capillary arrays, main source of possible gas fractionation between Titan’s atmosphere and the detector. Adapted from Niemann (2002).
Current usage metrics show cumulative count of Article Views (full-text article views including HTML views, PDF and ePub downloads, according to the available data) and Abstracts Views on Vision4Press platform.
Data correspond to usage on the plateform after 2015. The current usage metrics is available 48-96 hours after online publication and is updated daily on week days.
Initial download of the metrics may take a while.