Fig. A.1.
Download original image
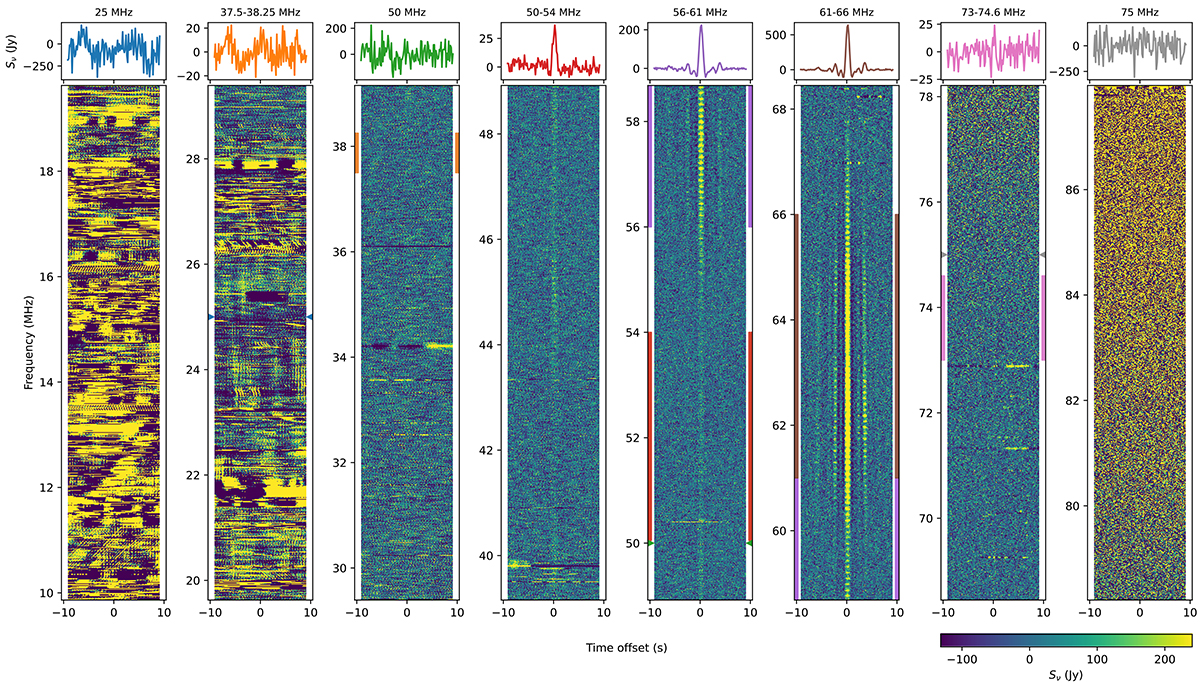
Spectral and temporal properties of the passage of the Starlink v2-Mini satellite Starlink-31441 [60091/2024-117A] (average of 11 TABs) in the LBA band from 10 to 88 MHz. Normalized, aligned, and averaged dynamic spectra (in power flux density units) are shown over the entire observed bandwidth and are centered on the predicted passage time of the satellite. Time series at specific narrowband frequencies and broadband frequency ranges are shown in the top insets. The color of each time series matches the marked frequencies and frequency ranges, in the same colors as the sides of the dynamic spectra.
Current usage metrics show cumulative count of Article Views (full-text article views including HTML views, PDF and ePub downloads, according to the available data) and Abstracts Views on Vision4Press platform.
Data correspond to usage on the plateform after 2015. The current usage metrics is available 48-96 hours after online publication and is updated daily on week days.
Initial download of the metrics may take a while.