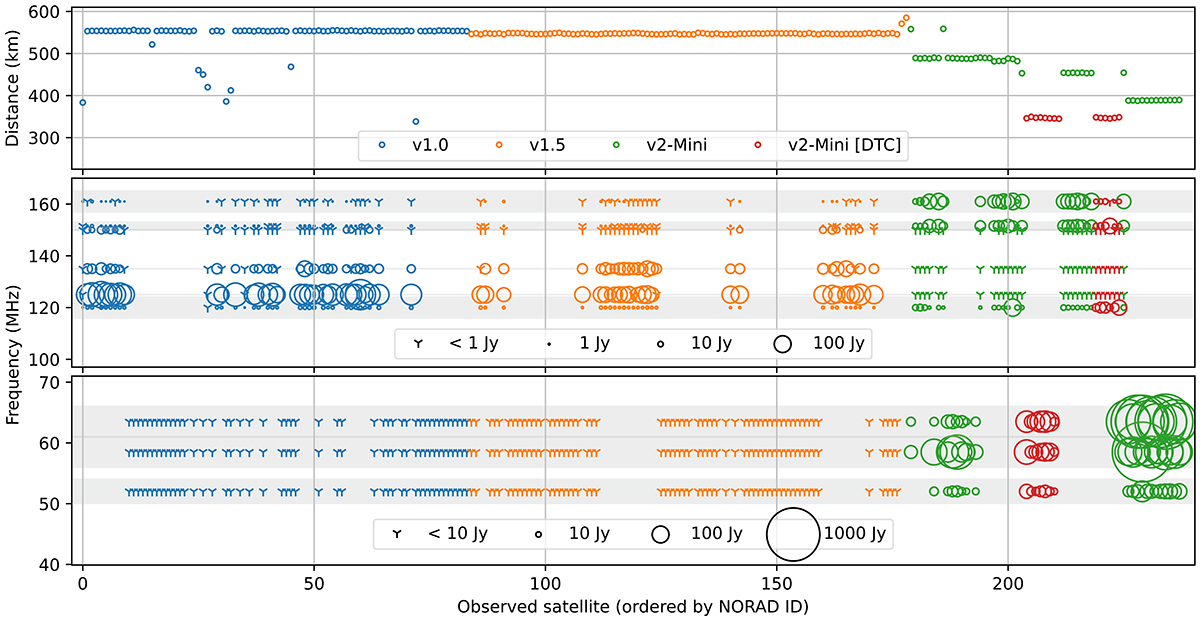
Fig. 1.
Download original image
Distances and power flux density measurements of Starlink satellites that passed through the beam pattern of the two 1 h LOFAR observations. The horizontal axis denotes the number of satellites that were observed, ordered by their NORAD catalog identifier. As this identifier sequentially increases with each launched satellite, this axis is essentially ordered in time. All satellites were observed near zenith, and hence their distances are comparable to their orbital altitudes. Power flux density measurements at the different narrowband frequencies or broadband frequency ranges are indicated with circles, where the size of the circle corresponds to the measured flux density. Nondetections are denoted by the ⋎ symbol. The horizontal gray lines and bands indicate the frequency ranges that were used for the flux density determination. There are separate legends for the LBA band from 10–88 MHz and the HBA band from 110–188 MHz. The different Starlink satellite versions are indicated with different colors.
Current usage metrics show cumulative count of Article Views (full-text article views including HTML views, PDF and ePub downloads, according to the available data) and Abstracts Views on Vision4Press platform.
Data correspond to usage on the plateform after 2015. The current usage metrics is available 48-96 hours after online publication and is updated daily on week days.
Initial download of the metrics may take a while.