Fig. A.1
Download original image
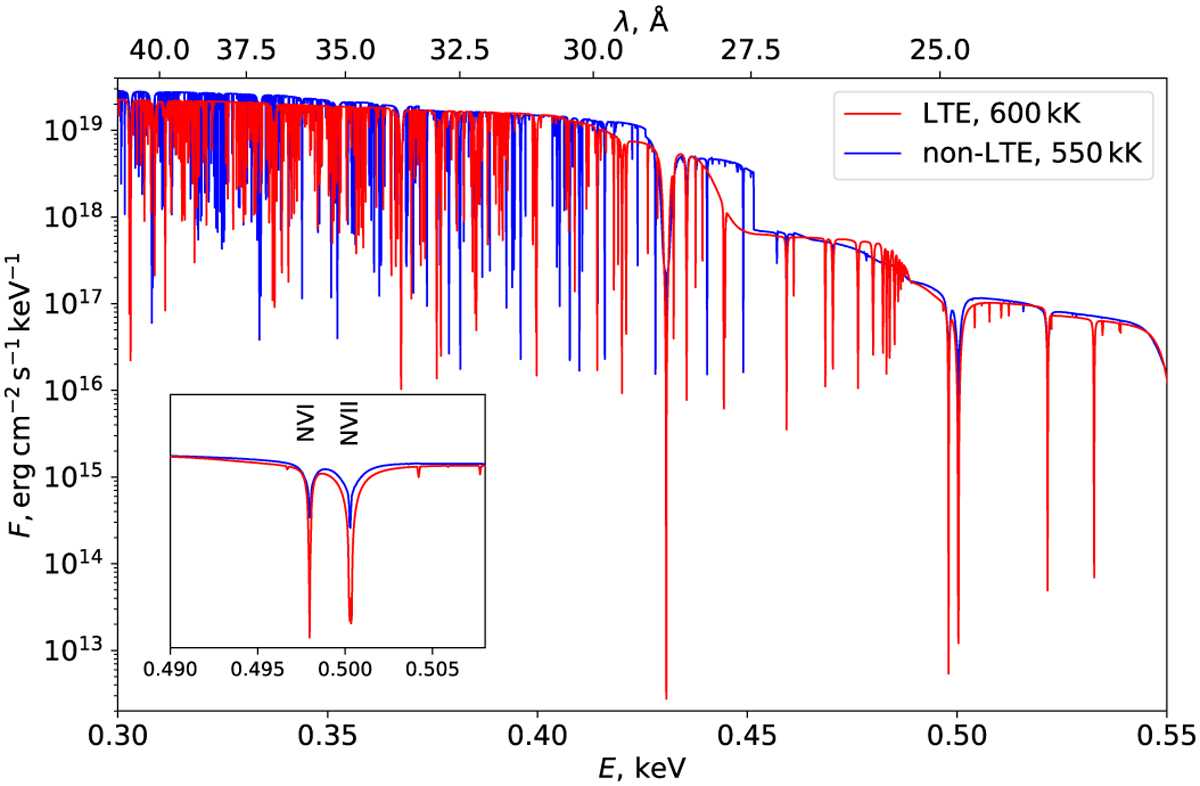
Comparison of the model atmospheres spectra computed by our code (in red) and the TMAP non-LTE code (Rauch et al. 2010, in blue). Shown are LTE model with Teff = 600 kK and scaled NLTE model with Teff = 550 kK. The gravity log g = 9 is fixed. The chemical composition corresponds to model 006 from Rauch’s grid. The lower left panel shows in detail the comparison of absorption line profiles.
Current usage metrics show cumulative count of Article Views (full-text article views including HTML views, PDF and ePub downloads, according to the available data) and Abstracts Views on Vision4Press platform.
Data correspond to usage on the plateform after 2015. The current usage metrics is available 48-96 hours after online publication and is updated daily on week days.
Initial download of the metrics may take a while.