Fig. 14
Download original image
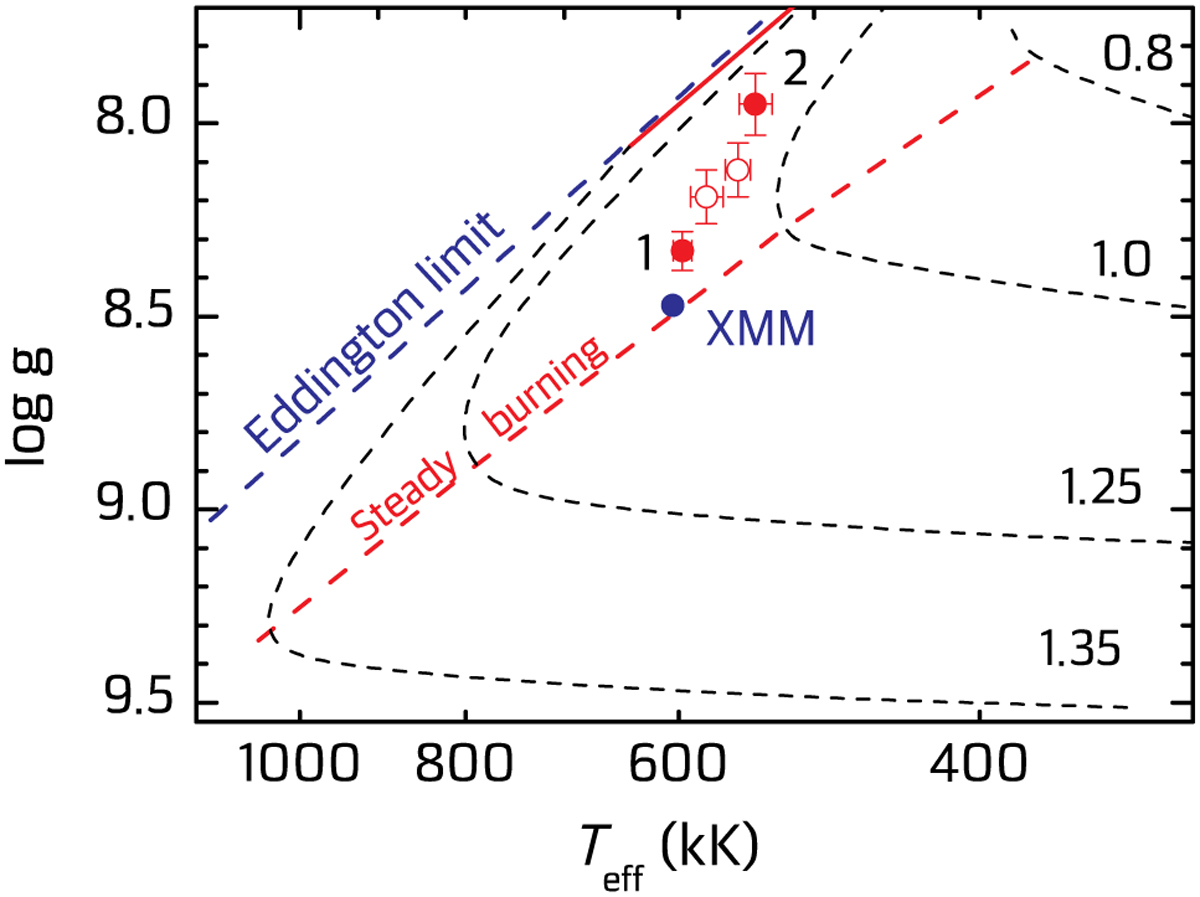
Positions of the source in the Teff − log g plane according to different eRASS observations (red circles with the number 1 and 2), and according to joint fit (red empty circles), see Table 3. The XMM spectrum fit with fixed NH is shown by blue circle. Model dependencies for various WD masses, taken from Nomoto et al. (2007), are shown by black dashed curves. The numbers at the curves indicate WD masses (in solar masses). The lower boundary of the stable thermonuclear burning band is shown by the dashed red line. The Eddington limit for solar H/He abundances is shown by the blue dashed line.
Current usage metrics show cumulative count of Article Views (full-text article views including HTML views, PDF and ePub downloads, according to the available data) and Abstracts Views on Vision4Press platform.
Data correspond to usage on the plateform after 2015. The current usage metrics is available 48-96 hours after online publication and is updated daily on week days.
Initial download of the metrics may take a while.