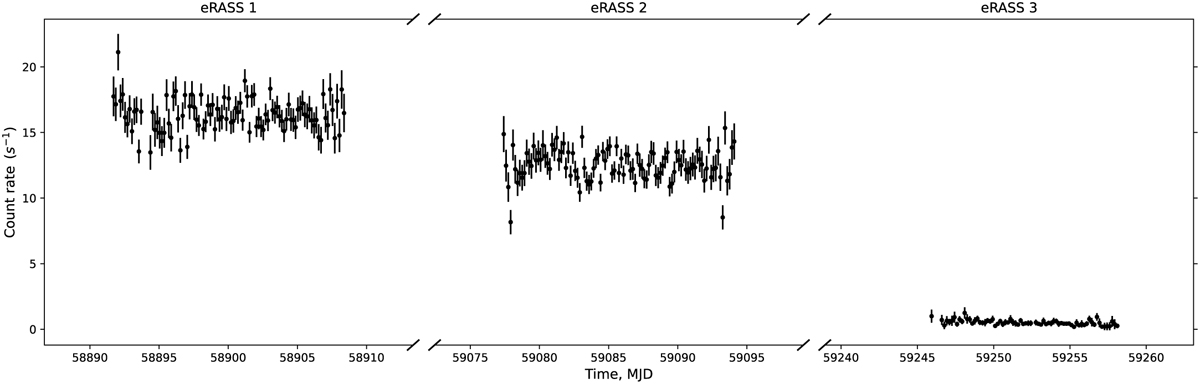
Fig. 1
Download original image
eROSITA light curve of AT 2018bej in the energy band 0.2–2 keV, combining data from TM1–TM4, and TM6. eROSITA scanned the source position during four epochs eRASS1–4 until the middle of 2021. The source was barely visible during eRASS3 (right panel) and was not detected during eRASS4. The XMM-Newton observation started ~10 days after the end of eRASS1 scanning. The Gehrels (1986) approximation is used for bins with unknown count rate errors.
Current usage metrics show cumulative count of Article Views (full-text article views including HTML views, PDF and ePub downloads, according to the available data) and Abstracts Views on Vision4Press platform.
Data correspond to usage on the plateform after 2015. The current usage metrics is available 48-96 hours after online publication and is updated daily on week days.
Initial download of the metrics may take a while.