Open Access
Fig. 1.
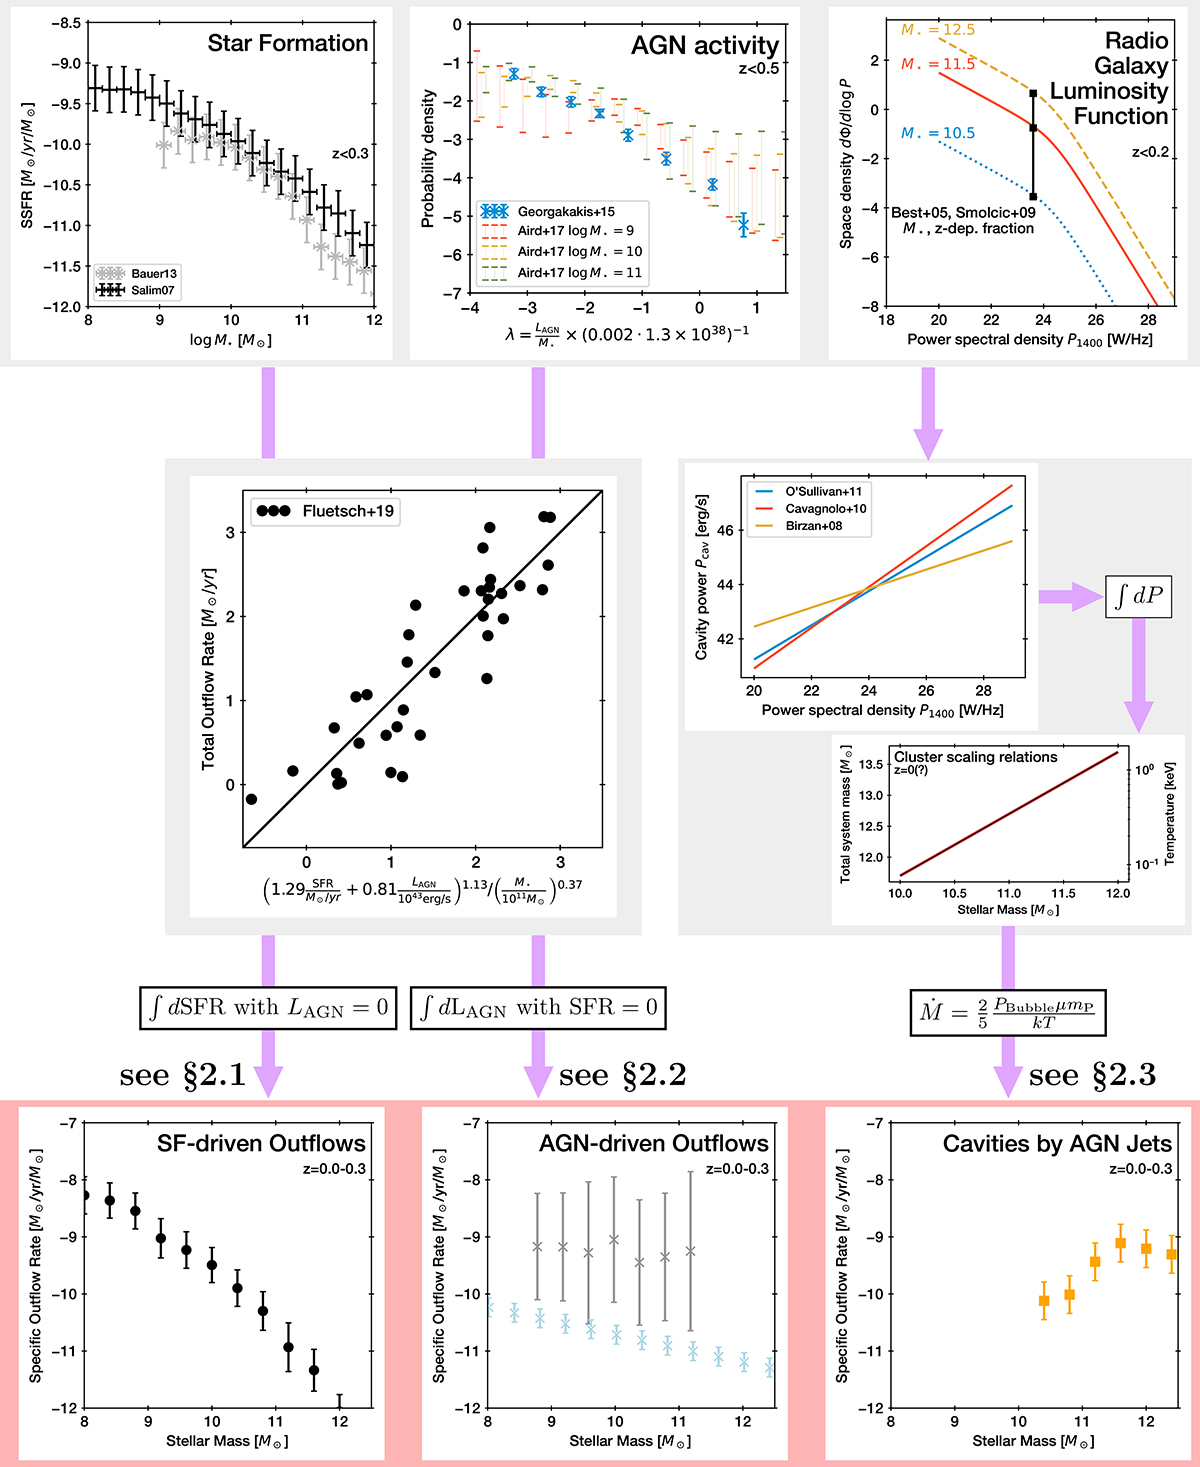
Download original image
Workflow starting from distribution functions (top row) that are convolved with scaling relations (middle row) into rates of mass displacement (bottom row) at a given galaxy stellar mass and redshift. We show the lowest-redshift bin.
Current usage metrics show cumulative count of Article Views (full-text article views including HTML views, PDF and ePub downloads, according to the available data) and Abstracts Views on Vision4Press platform.
Data correspond to usage on the plateform after 2015. The current usage metrics is available 48-96 hours after online publication and is updated daily on week days.
Initial download of the metrics may take a while.