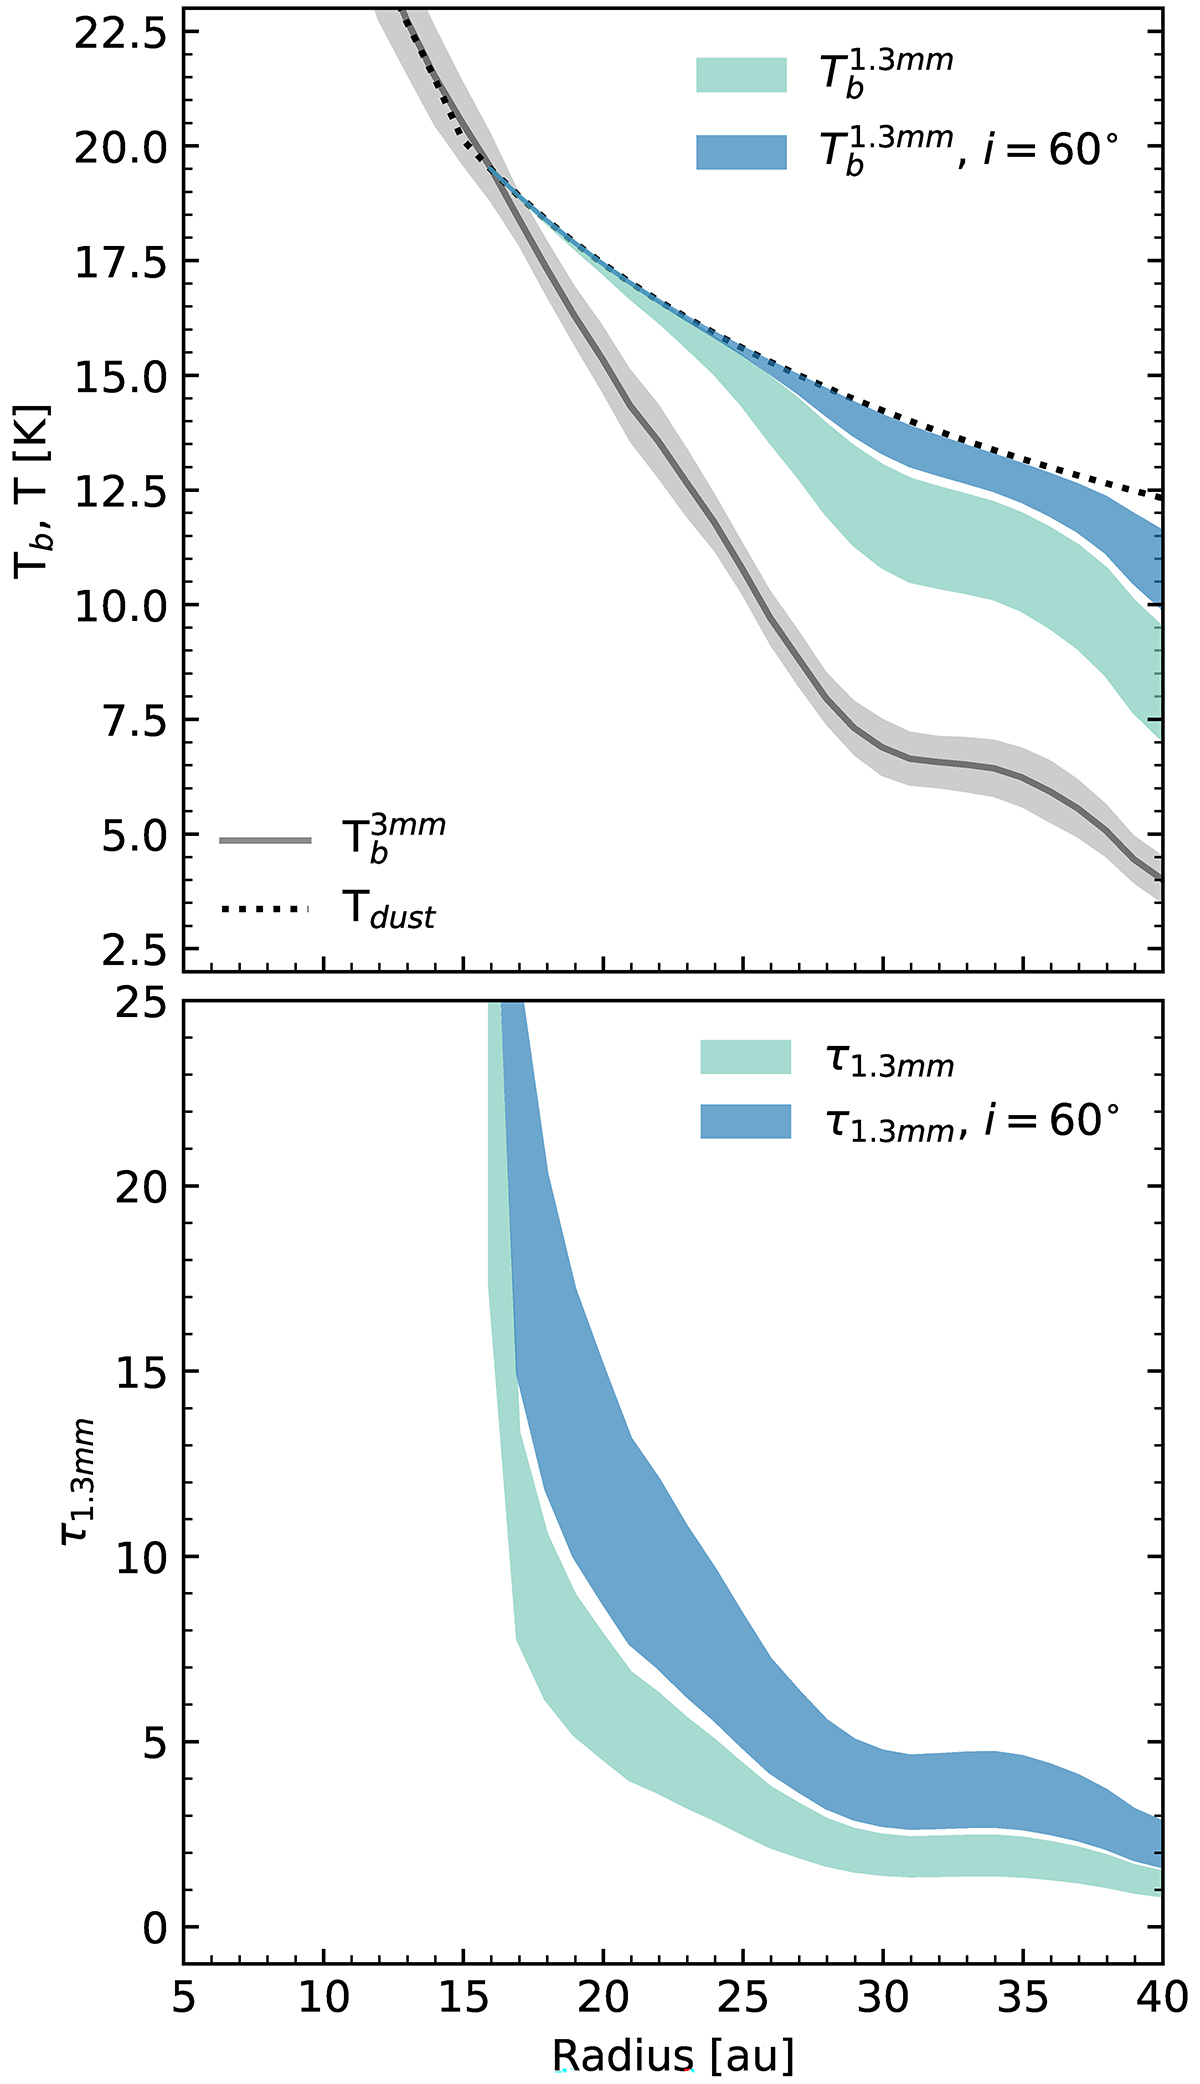
Fig. C.1.
Download original image
Predictions for the brightness temperature and optical depth profiles at 1.3 mm based on the observed 3 mm profile for SM1 (solid gray line). The widths of the shaded areas correspond to the resultant range of the profiles, considering β between 1 and 1.7. The darker blue corresponds to the predicted profile if the disk had been observed at a higher inclination (i = 60°). The black dotted line corresponds to the derived temperature for SM1 as in Figure 3.
Current usage metrics show cumulative count of Article Views (full-text article views including HTML views, PDF and ePub downloads, according to the available data) and Abstracts Views on Vision4Press platform.
Data correspond to usage on the plateform after 2015. The current usage metrics is available 48-96 hours after online publication and is updated daily on week days.
Initial download of the metrics may take a while.