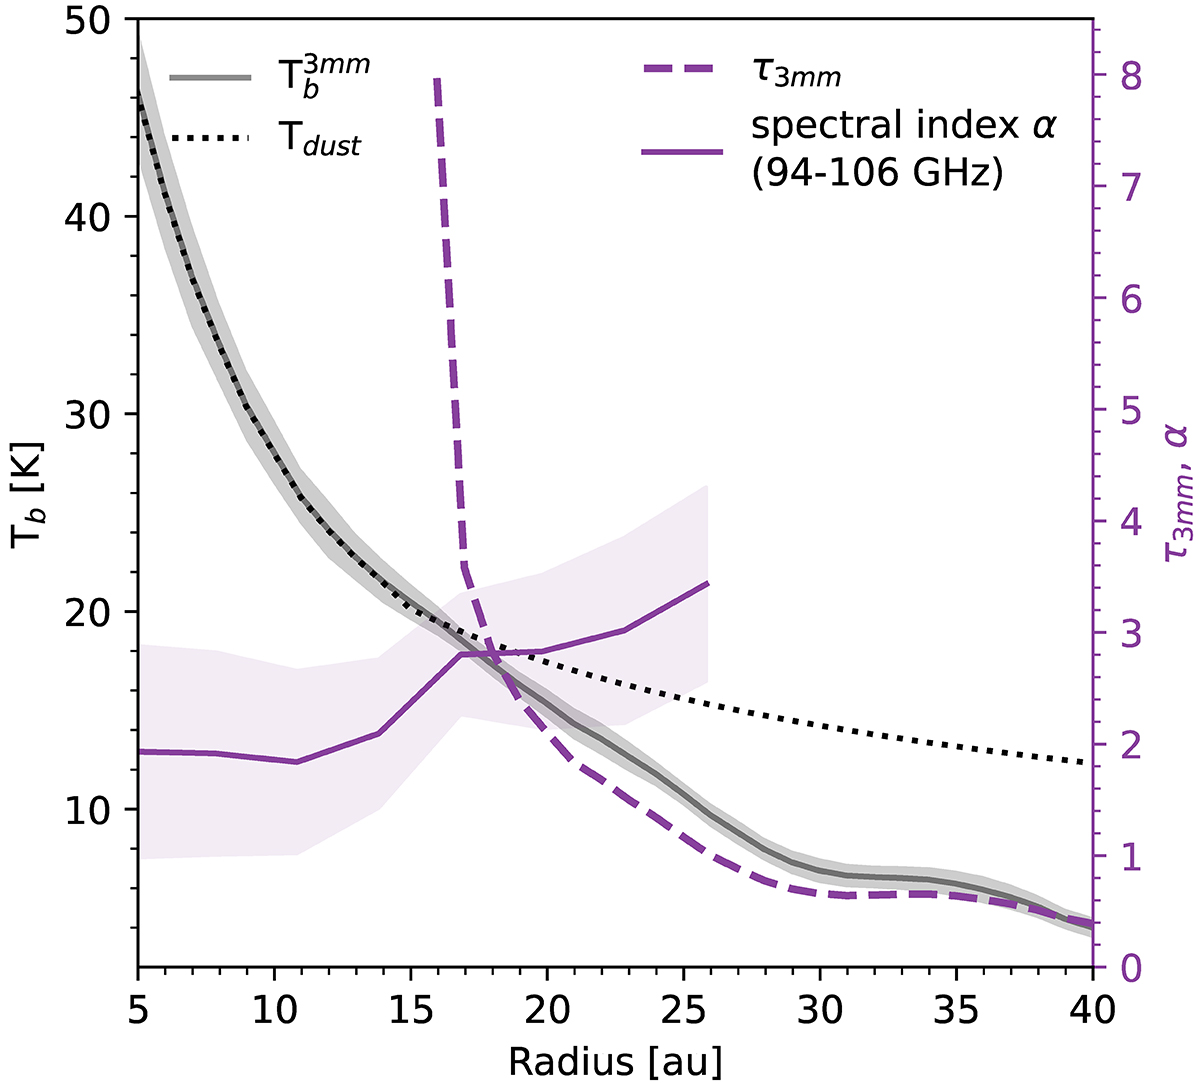
Fig. 3.
Download original image
Radial profiles of the in-band spectral index, optical depth, and temperature towards SM1. The solid purple line shows the in-band spectral index. The shaded area shows the 1σ uncertainty. The estimated 3 mm optical depth and temperature profiles are shown with dashed purple and dotted black lines, respectively. The temperature profile is extrapolated beyond r ∼ 15 au following a r−0.5 power law. The observed brightness temperature profile is overlaid in solid gray, similar to Figure 1.
Current usage metrics show cumulative count of Article Views (full-text article views including HTML views, PDF and ePub downloads, according to the available data) and Abstracts Views on Vision4Press platform.
Data correspond to usage on the plateform after 2015. The current usage metrics is available 48-96 hours after online publication and is updated daily on week days.
Initial download of the metrics may take a while.