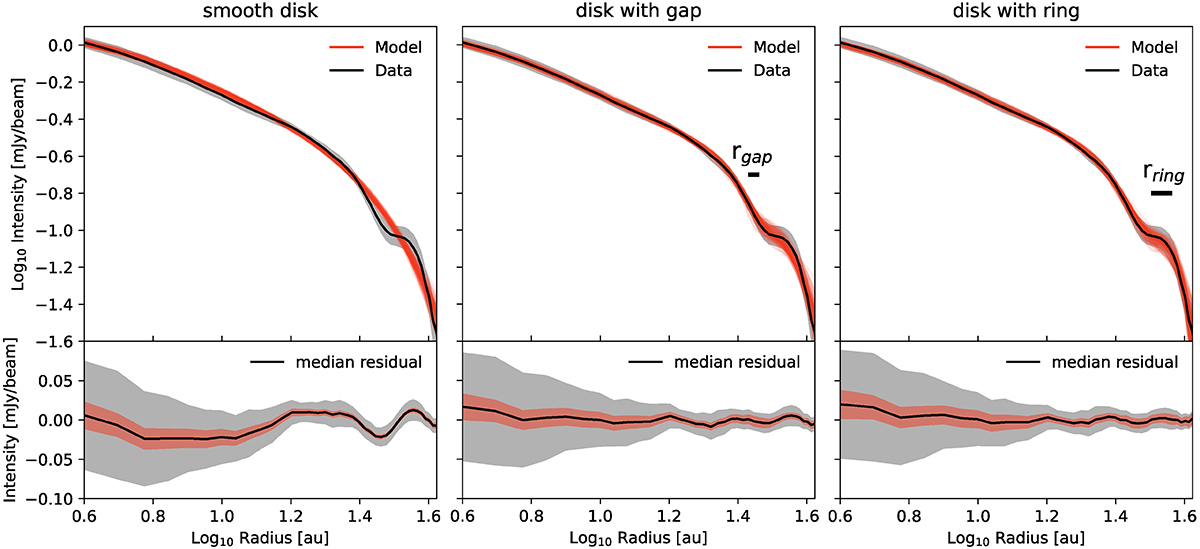
Fig. 2.
Download original image
Fits to the disk intensity profile and residuals for three different models. The orange curves in the top panels show 100 profiles drawn randomly from the posterior distributions. The observed profile is shown with a black solid line. The resultant median residual is shown in the bottom panels (solid black line) as well as 1σ dispersion around the median residual (orange shaded area). The gray shaded area corresponds to the 1σ uncertainty of the intensity profile in all panels. Left: Smooth disk profile. Middle: Disk profile with a gap at ∼28 au. The black horizontal segment shows the range of values for the gap radius enclosing 68% of the posterior distribution around the median. Right: Disk profile with a ring at ∼34 au. The black horizontal segment shows the range of values for the ring radius enclosing 68% of the posterior distribution around the median.
Current usage metrics show cumulative count of Article Views (full-text article views including HTML views, PDF and ePub downloads, according to the available data) and Abstracts Views on Vision4Press platform.
Data correspond to usage on the plateform after 2015. The current usage metrics is available 48-96 hours after online publication and is updated daily on week days.
Initial download of the metrics may take a while.